
Learning How to Communicate Visually in Documentation
From my recent survey on why users can't find answers in help, many users voted on the following reason:
- The answer is buried in a long page, but the user only spends 2 minutes max on a page scanning. (survey results)
The page may be 1,500 words long, but the user spends just a few seconds quickly scanning the page and misses the answer.
In an earlier post, I talked about using subheadings as a way to overcome the problem of page length. Subheadings are an excellent technique for facilitating scanning, but there's another technique that is even more powerful: visuals. Visuals not only draw the user's attention and focus, a good visual communicates meaning almost instantaneously.
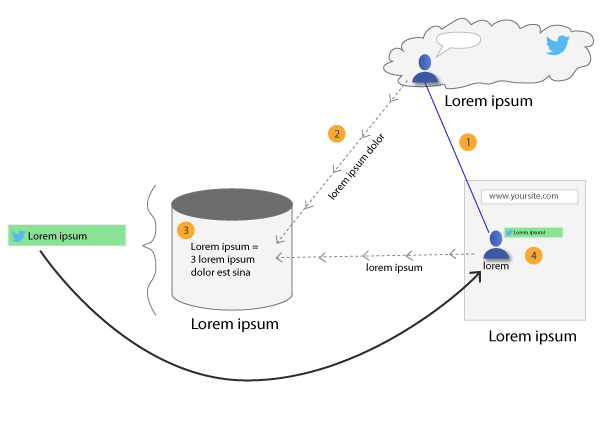
I noticed this the other day as I pointed someone to an article I'd written. The article had a visual diagram. As soon as the person arrived at the page, he studied the graphic for several seconds and then started responding to the ideas -- without even reading the article.
The lengthy text had taken a backseat to the reader's focus and attention on the visual. I suspect most people looking at a page with a strong graphic do the same -- respond immediately to the visual while ignoring the text.
There's a reason our eye naturally moves to visuals: they're the quickest and easiest way to understand something. We can process visual cues and meaning unconsciously in the blink of an eye, even before our conscious mind registers what's going on (see Malcolm Gladwell's Blink). Given this efficiency, it's no wonder that visuals are the starting point for our attention -- why waste time unnecessarily?
I noticed the power of visual communication last week. I brought home a diagram I'd created to depict a process I'd been writing about all day at work. I asked my 12-year-old to tell me what the diagram was trying to show. She studied it a minute, and then to my astonishment described with near exactness what I was trying to depict. I was floored.
Where to place visuals
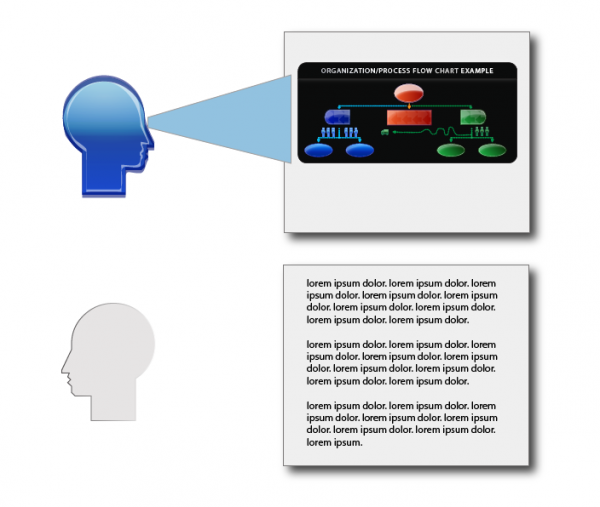
There are a few key places where visuals are key. When you're introducing an idea, a visual in your conceptual overview makes a great lead-off image to an article, inviting the reader's attention. Right from the start, the image pulls the reader into the text.
But the visual should be more than just an image. In documentation, a visual illustrates an idea, clarifying a process or concept in a meaningful way. You're not just adding decorative images for the sake of breaking up text (although that's not entirely bad), you're adding images to instruct and teach the reader about new ideas. Illustrations make a point. We're not talking about art and mood or color for the sake of art alone. Visuals are doing work to instruct.
While you're instructing the reader with new concepts and ideas, you can leverage illustrations to reinforce the meaning. As soon as you leave the land of conceptual information, though, and are just listing steps to complete a task, there's no need for concept diagrams or idea-rich illustrations.
In these supporting task areas, screenshots work well to provide more visual rhythm and interest. A screenshot may not teach the user a new concept, but the screenshot does provide follow through in showing the user how to execute on the concept.
What makes a good visual
When creating visuals, a lot of technical writers feel intimidated about their lack of artistic skills. After all, graphic designers can create much more spiffy, sharp-looking graphics.
Fortunately, the more minimal the graphic, the better. All of those graphic details just tend to get in the way. When you strip down the graphic to its bare bones, you draw more attention to the point of the graphic.
In contrast, if you include a lot of graphic detail in your illustrations, you risk shifting the focus to the artistic details rather than the point of the visual. Besides introducing a lot of distracting elements (Edward Tufte calls unnecessary graphics "chartjunk,"), creating more realistic, detailed art creates a lot of extra work for yourself.
For example, let's say you need to depict a person crossing the street. You could download a fancy vector icon showing a person fully colored, with detailed hair, shading, and even facial features. The person may be wearing a suit or collar shirt and have other characteristics. It may be a great looking graphic, but now you've got more burden to keep up the same degree of artistic realism.
To go along with the vector graphic, you'll need to also create a similar looking street, with shading and perspective. You'll need to create a road with contours and texture. You'll perhaps need some sky and surrounding elements. Before you know it, your meager attempt to show a person crossing a street has become a full-fledged artistic production consuming days of work and unnecessary labor.
And what will the result be? Unless you have a lot of artistic talent and command of illustration tools, the result will probably look somewhat unprofessional.
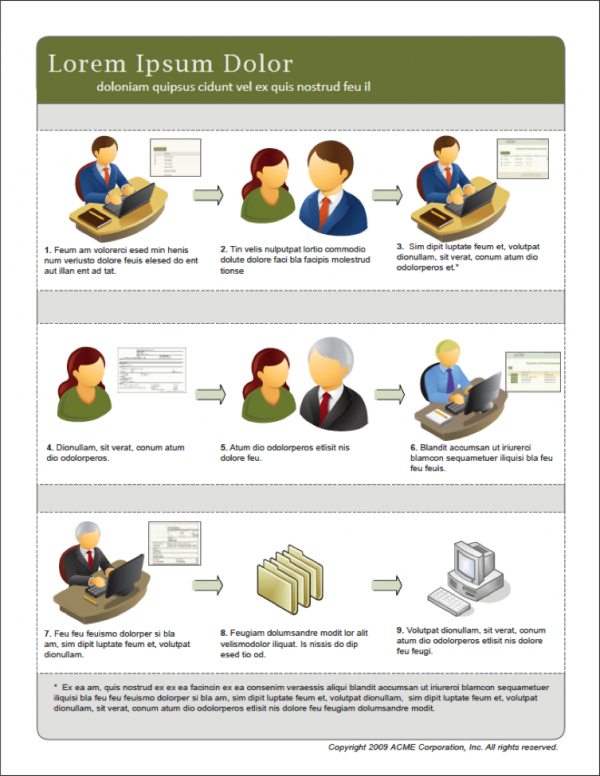
As an example, take a look at this quick reference guide I made several years ago. The vector icons clearly don't match the visuals used elsewhere in the guide.
Instead of aspiring for realism, you'll be more successful with visual communication if you follow a principle of minimalism. What are the minimum lines you need to communicate the idea? Rather than focusing on whether you got the shading right based on the angle of the sun, with minimalist illustrations the audience focuses only on the illustration's meaning, because that's the only element really available to evaluate.
Think about the walk signal when crossing the street. Here it is, in all its plainness:
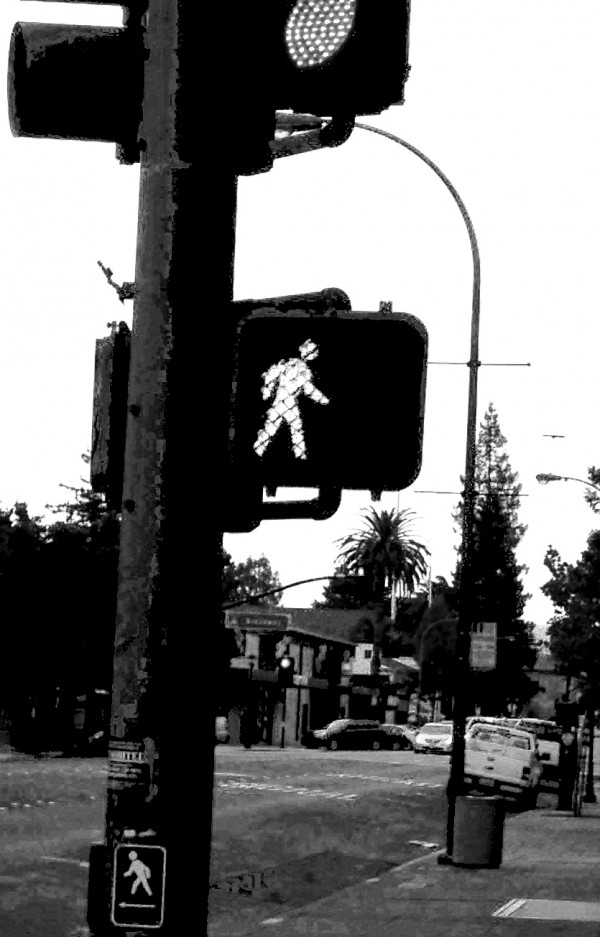
No need for fancy graphics here to get the job done. The walk signal is just a simple mix of rectangles and circles.
Cognitive load
In Graphics for Learning: Proven Guidelines for Planning, Designing, and Evaluating Visuals in Training Materials, Ruth Clark and Chopeta Lyons explain that removing distracting and non-essential elements of visuals can reduce cognitive load and help users focus on what really matters.
Here's an image from their book that compares a photograph versus a line drawing in a car guide:
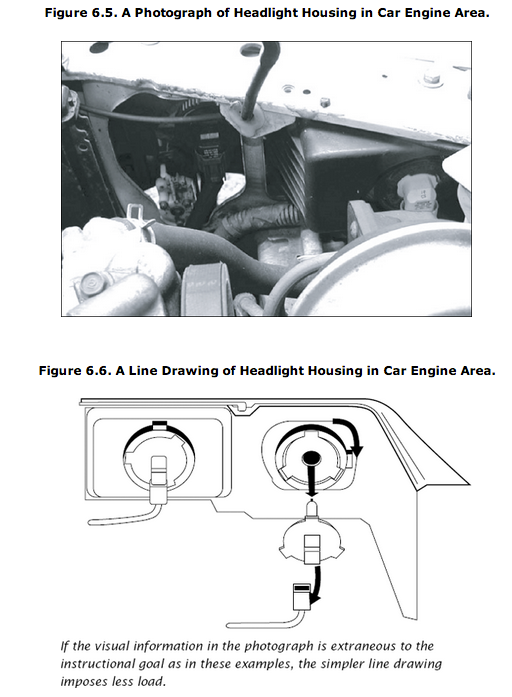
Clark and Lyons explain:
... in situations where the learner has little control over the pacing of the lesson such as in a short animated sequence (instructional control rather than learner control), simpler line drawings result in better learning than do complex realistic illustrations. On the other hand, more complex illustrations sometimes result in more learning when learners have unlimited time to study the graphic (Levie, 1987). Therefore, we recommend that you plan graphics at the lowest level of complexity that will support the instructional goal, especially when the content is new, there are complex visual discriminations involved, and when the materials are presented out of learner control. (Chapter 6)
In other words, graphics that have the lowest level of complexity often have the biggest impact on users who are pressed for time. But if your users have a lot of time to spend looking at visuals (I'm not sure who these people might be), go ahead and add more detail in the illustrations.
Overall, I think minimalist graphics are a win-win situation -- easier to create, and more powerful for learning.
Tracing stuff is easy
Did you also know that if you need to create minimalist shapes, it's really easy in Illustrator? Today virtually everyone has a camera phone. Take a picture of something you want to draw. Now bring that picture into Illustrator, put it on its own layer and increase the transparency. Add another layer and use the pen tool to trace it. Then fill it in with color.
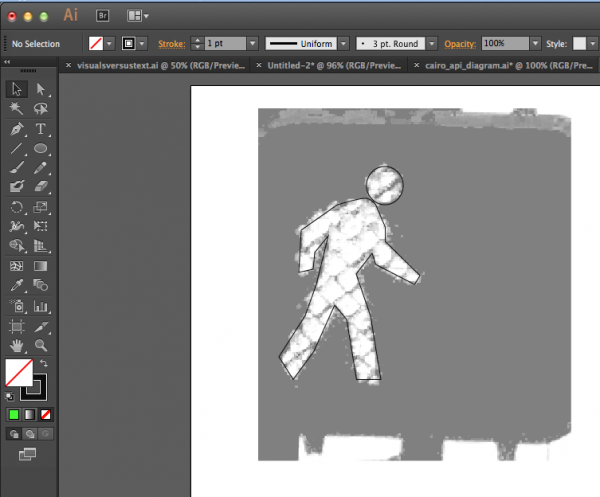
Voila -- in about 5 minutes, you've got an immediately recognizable shape, and if you took the original photograph, you don't have to worry about copyright infringement (most of the time).
Art is fun
I think technical manuals would be a lot more engaging if each section opened with a visual diagram that communicated to the user visually rather than beginning with long textual explanations.
Visual techniques are totally within our grasp, but we're often held back by assumptions about graphic design skills and professionalism. One element that might help overcome this fear is simply this: Art is fun.
Think back to your high school art class. Right now art is my daughter's favorite class. You know why? Because she gets to create stuff -- drawings from her own imagination.
Tech writing should be the same way. After all of those textual instructions, explaining and numbering with steps, and nearly dying of plainness, here's a chance to let your hair down and get creative. Draw. Put on the headphones and turn up the music, and then just let your mind wander with a pencil and paper. This is the fun part of technical writing! Skipping this part in a tech comm career is like skipping art so you can take an extra math class.
The hard part is the concept, not the execution
When you start drawing, you'll soon learn that the hard part isn't the execution. It's the drawing. This is what Don Moyer said during his presentation on visuals at an STC session a few years ago. The difficulty is figuring out how to depict an idea in visual form.
Here are some doodles I made tonight while brainstorming ways to show a "mission."
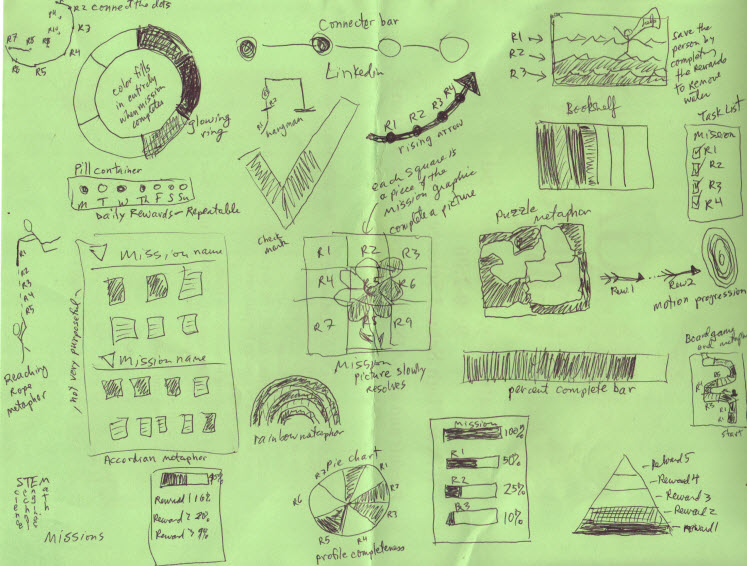
Even if you were to have a graphic designer at your disposal, to create whatever you wanted, you'd still need to give the graphic designer a sketch on paper illustrating the idea you wanted to convey.
Communicating visually is difficult in part because we do it so infrequently, Lyons and Clark explain. We've become used to relying on words -- lots of them -- to communicate ideas. But the more we exercise the visual dimensions of our brain, perhaps by frequently sketch-noting during meetings, or doodling, or even playing Pictionary, the more we develop an ability to communicate visually.
About Tom Johnson

I'm an API technical writer based in the Seattle area. On this blog, I write about topics related to technical writing and communication — such as software documentation, API documentation, AI, information architecture, content strategy, writing processes, plain language, tech comm careers, and more. Check out my API documentation course if you're looking for more info about documenting APIs. Or see my posts on AI and AI course section for more on the latest in AI and tech comm.
If you're a technical writer and want to keep on top of the latest trends in the tech comm, be sure to subscribe to email updates below. You can also learn more about me or contact me. Finally, note that the opinions I express on my blog are my own points of view, not that of my employer.