
Are technical writing blogs growing or dying?
- “Blogging is dead”!!???
- Google trends
- 2015 vs 2014
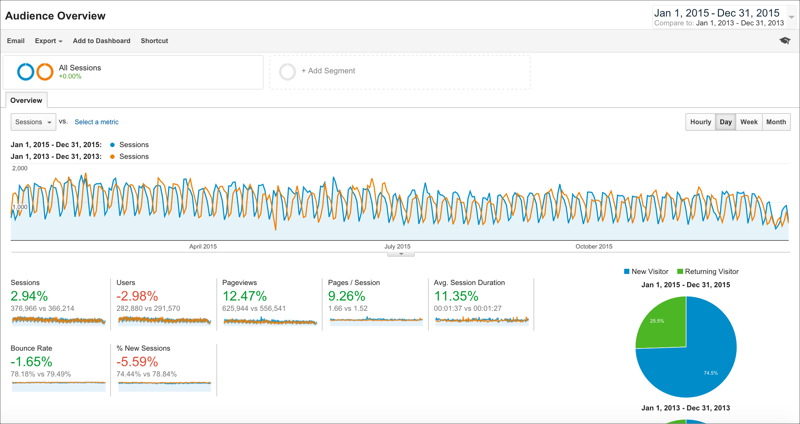
- 2015 vs 2013
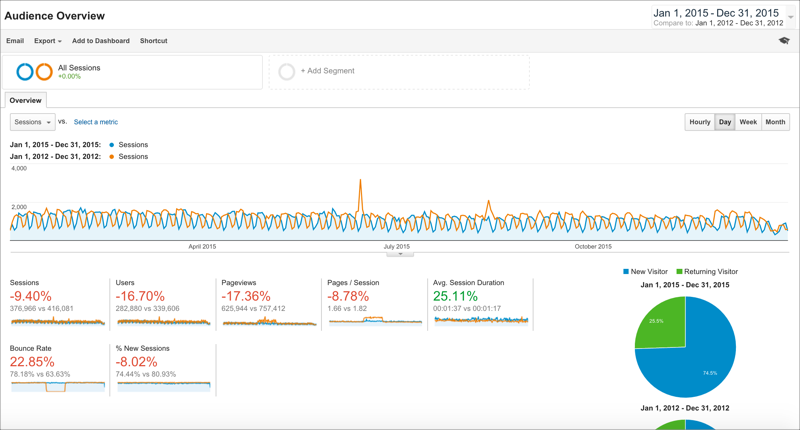
- 2015 vs 2012
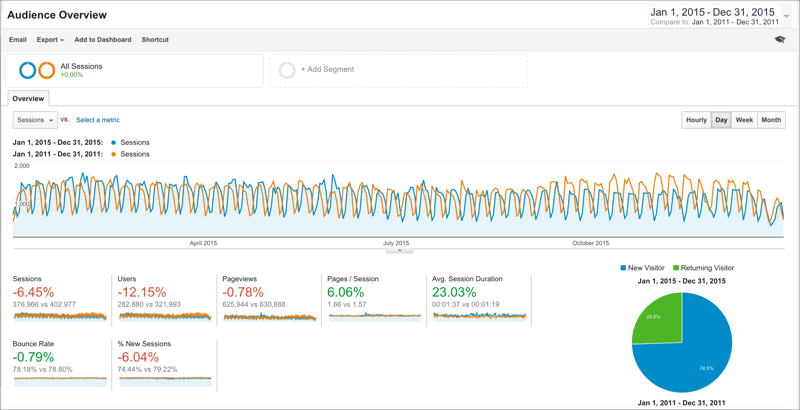
- 2015 vs 2011
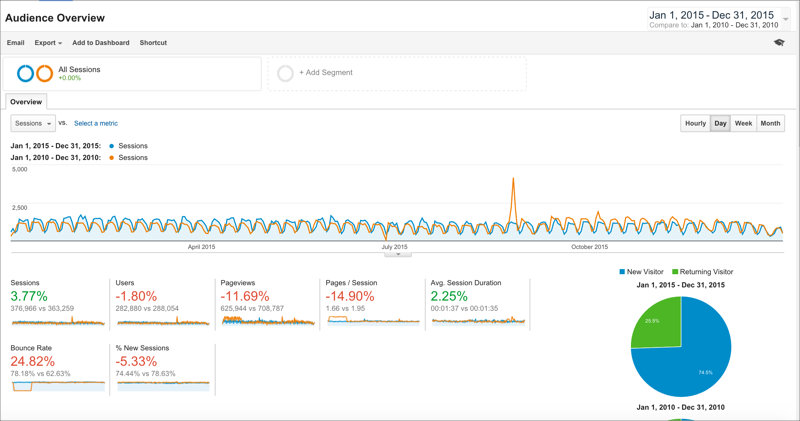
- 2015 vs 2010
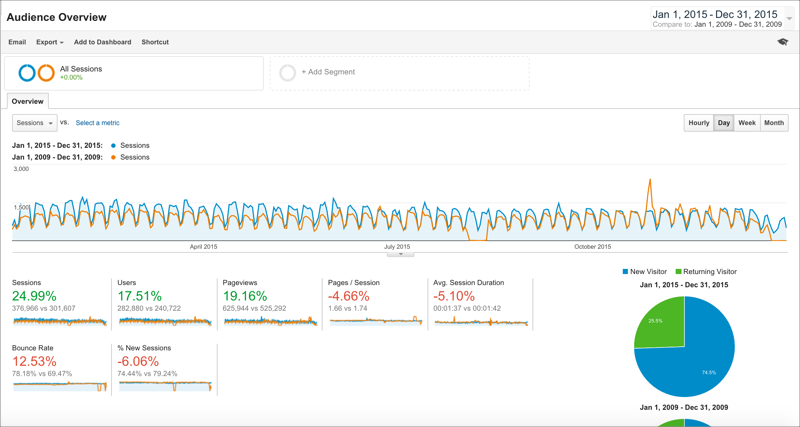
- 2015 vs 2009
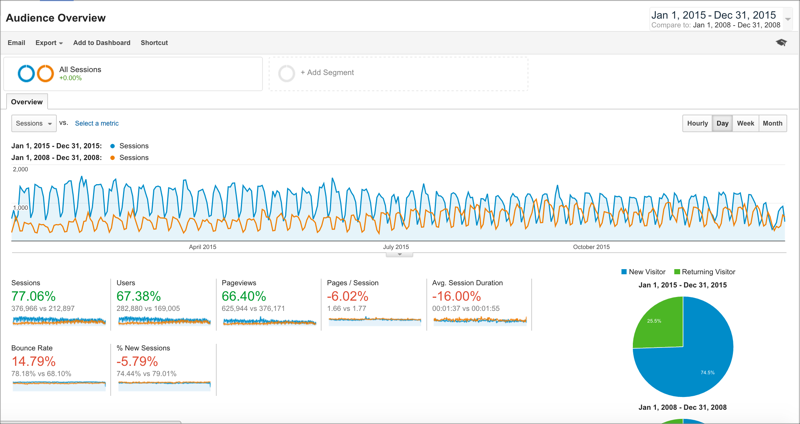
- 2015 vs 2008
- Traffic compared to posts
- Conclusion
“Blogging is dead”!!???
Every so often someone either proclaims that blogging is dead or asserts that blogging is alive and well. Recently someone noted that the 2015 vs. 2014 statistics comparison graph in my 2015 top posts analysis post looked interesting, so I decided to explore this comparison a little more to try to assess whether blogging (particularly my technical writing blog) was growing or dying.
Google trends
First, take a look at this Google Trends graph looking at blogging and technical writing.
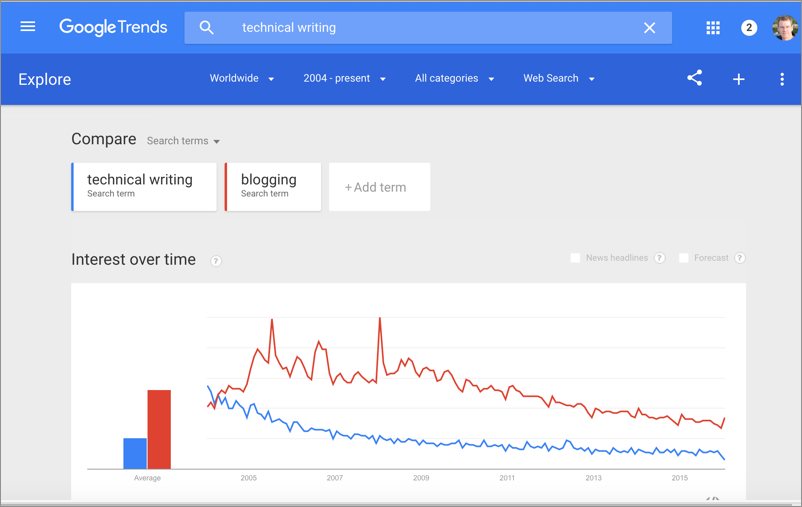
Looking at these trends, you might assume that a blog — particularly a blog on technical writing — is sliding into oblivion. Is it? Let’s look back at site stats for the past 7 years to see if we can note any trends in traffic.
Pay particular attention to the sessions statistic. According to Google Analytics,
A session is a group of interactions that take place on your website within a given time frame. For example a single session can contain multiple screen or page views, events, social interactions, and ecommerce transactions. (See How a session is defined in Analytics.)
A single session is basically a visit — it can consist of multiple pageviews.
In each of the following graphs, I compare the sessions during 2015 to a different year. Following the graphs is my explanation and analysis.
2015 vs 2014

2015 vs 2013
2015 vs 2012
2015 vs 2011
2015 vs 2010
2015 vs 2009
2015 vs 2008
(Although I started the blog in 2006, I didn’t actively start tracking it with Google Analytics until late 2007.)
Traffic compared to posts
Traffic is partly dependent on how many posts I publish each year. The following table shows the year, the number of sessions, posts published, and cumulative posts on the blog. (I omitted “pages” published.)
| Year | Sessions | Posts published | Cumulative posts on blog |
|---|---|---|---|
| 2008 | 212,897 | 258 | 672 |
| 2009 | 301,607 | 333 | 1005 |
| 2010 | 363,259 | 228 | 1233 |
| 2011 | 402,977 | 156 | 1389 |
| 2012 | 416,081 | 109 | 1498 |
| 2013 | 366,214 | 88 | 1586 |
| 2014 | 379,772 | 116 | 1702 |
| 2015 | 376,966 | 145 | 1847 |
In 2009 and 2010, I converted a lot of microposts that I had published on WriterRiver.com (no longer available) onto my regular blog. These microposts were simply short paragraphs describing interesting links about various tech comm articles. That’s why these years had so many more posts.
Conclusion
Overall, it seems 2011 and 2012 were the best years for blogging. Despite adding about 350 posts since 2012, the overall number of sessions decreased by about 10 percent in 2015.
Older posts are downgraded in Google’s page ranking algorithm. “Recency” is one way Google’s search returns list serves up fresh, new content. Backlinko, an SEO site, says “Recency of Content Updates” is ranked 25 of 200 in Google’s Pagerank factors:
- Recency of Content Updates: Google Caffeine update favors recently updated content, especially for time-sensitive searches. Highlighting this factor’s importance, Google shows the date of a page’s last update for certain pages … (See Google’s 200 Ranking Factors: The Complete List.)
This makes blogging a business of continual writing. Michael Arrington of TechCrunch.com once compared blogging to reaching down and grabbing a handful of sand. The sand slowly slips through your fingers. You have to reach down and grab another handful of sand, and another, and another. In the metaphor, your visitor’s sessions are the sand; your reaching and scooping — those are the new posts you have to write.
Is blogging dying or growing? I’m not sure. My blog’s number of sessions has slightly declined, but there are also more sites and content online for people to consume. The amount of content online each year grows by millions if not billions (or trillions) of pages, so the capacity to capture someone’s attention is diluted by the increased amount of online media available.
About Tom Johnson

I'm an API technical writer based in the Seattle area. On this blog, I write about topics related to technical writing and communication — such as software documentation, API documentation, AI, information architecture, content strategy, writing processes, plain language, tech comm careers, and more. Check out my API documentation course if you're looking for more info about documenting APIs. Or see my posts on AI and AI course section for more on the latest in AI and tech comm.
If you're a technical writer and want to keep on top of the latest trends in the tech comm, be sure to subscribe to email updates below. You can also learn more about me or contact me. Finally, note that the opinions I express on my blog are my own points of view, not that of my employer.