

Site analytics for 2021 -- a few observations and reflections
- Overall traffic trends during the year
- Traffic sources
- Confusing “Users” versus “New Users” metrics
- Times of day and location
- Overall takeaways
Overall traffic trends during the year
First, unfortunately traffic waned a bit for the last half of the year. I attribute this to my less frequent posting and online activity during the second half of the year, as well as general online reader fatigue from the pandemic.
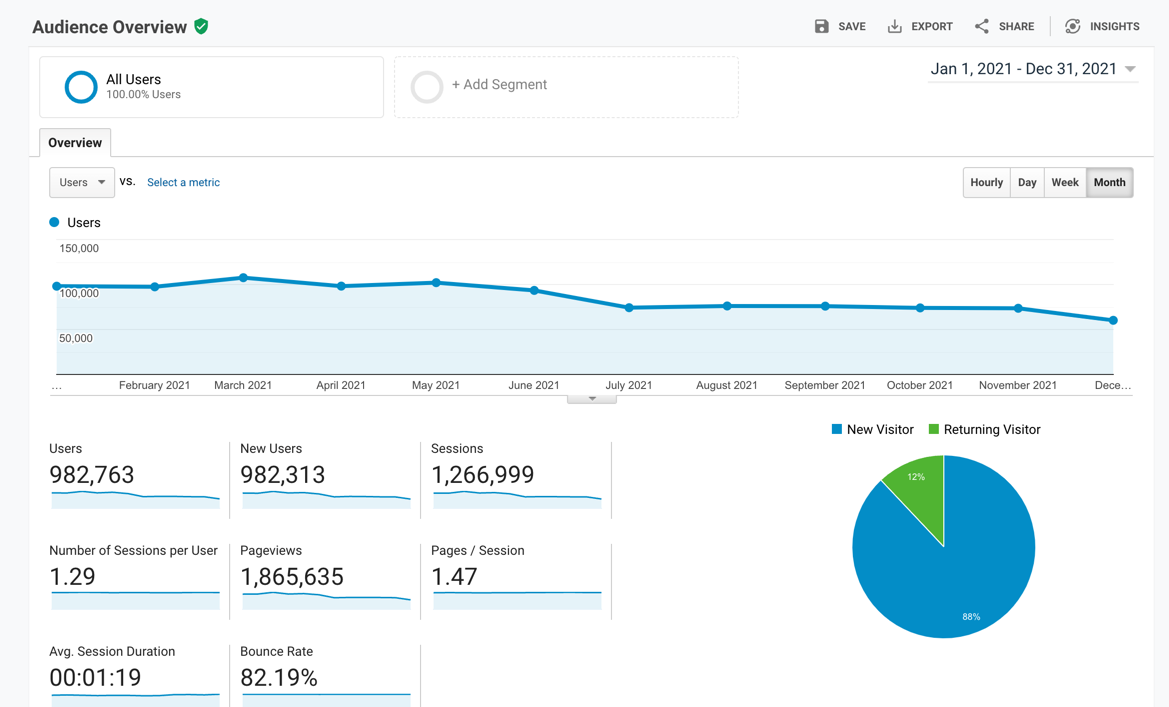
Even so, there were more sessions this year than the previous two years: 1,207,264 sessions (2019) -> 1,195,729 sessions (2020) -> 1,266,999 sessions (2021).
Traffic sources
Traffic to the API doc site has remained strong, accounting for 76% of site traffic.
In social, YouTube has become a growing contributor to traffic origination. YouTube’s percentage of social traffic has grown from 8% (2019) -> 13% (2020) -> 19% (2021).
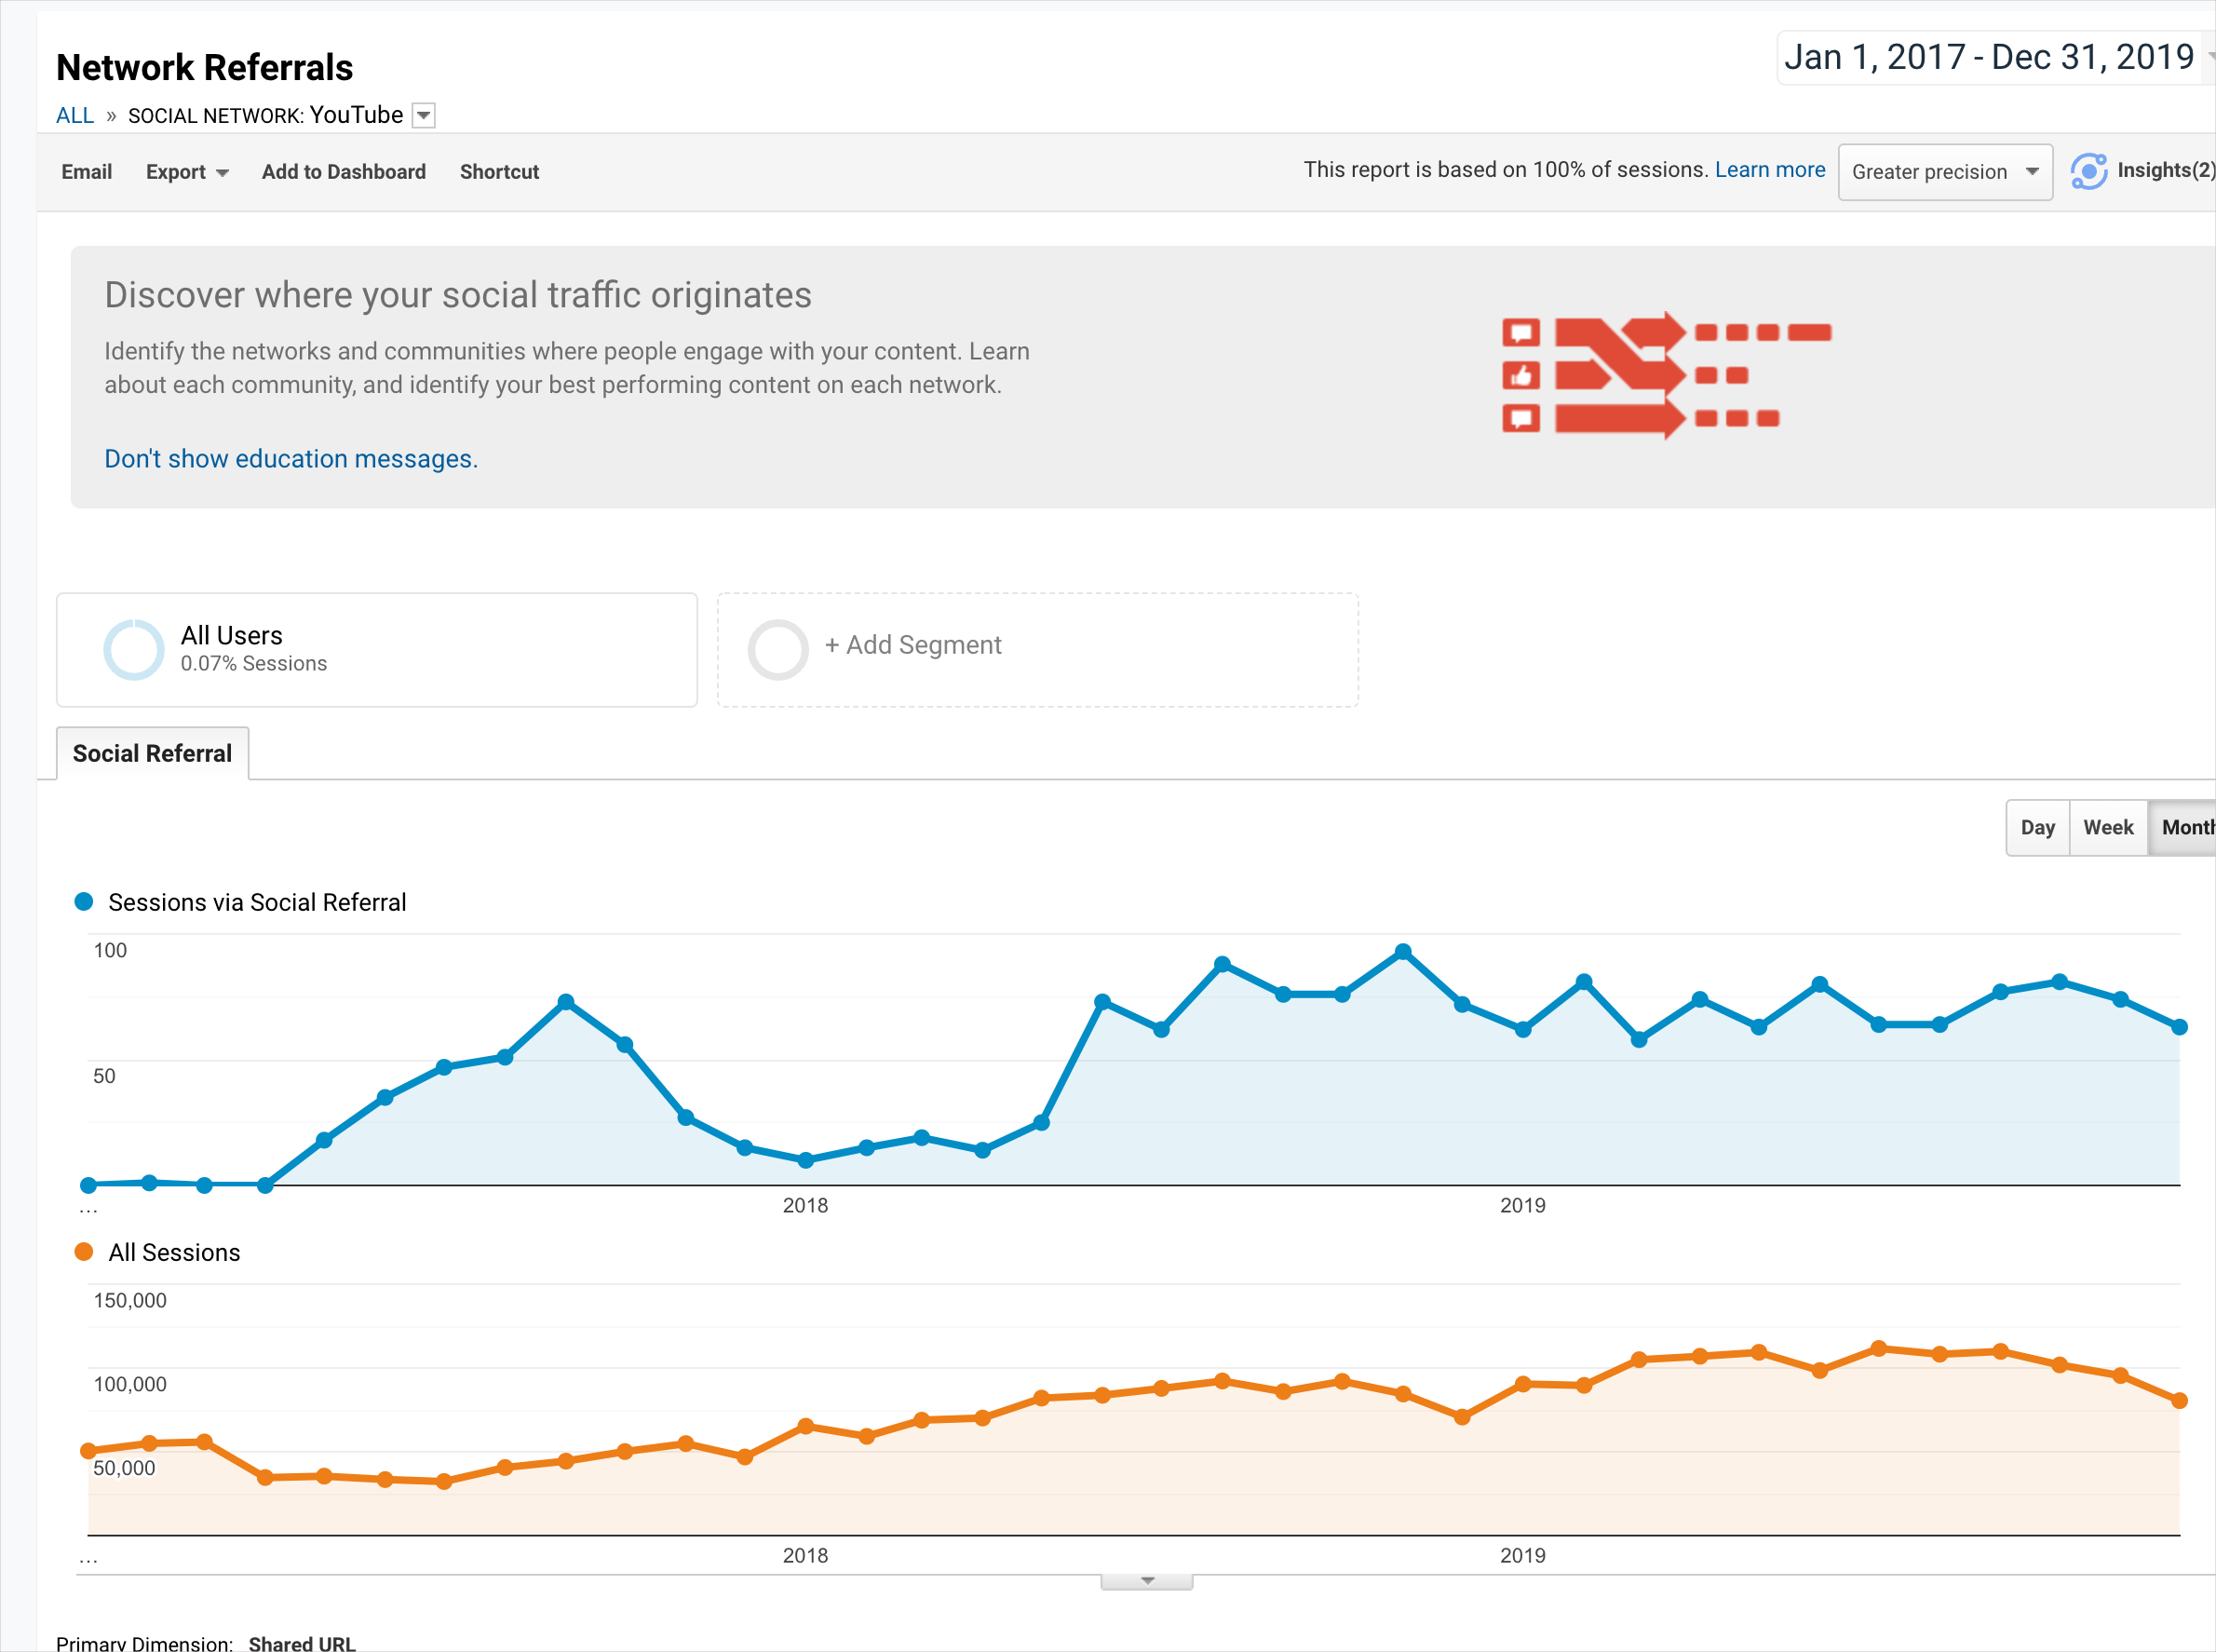
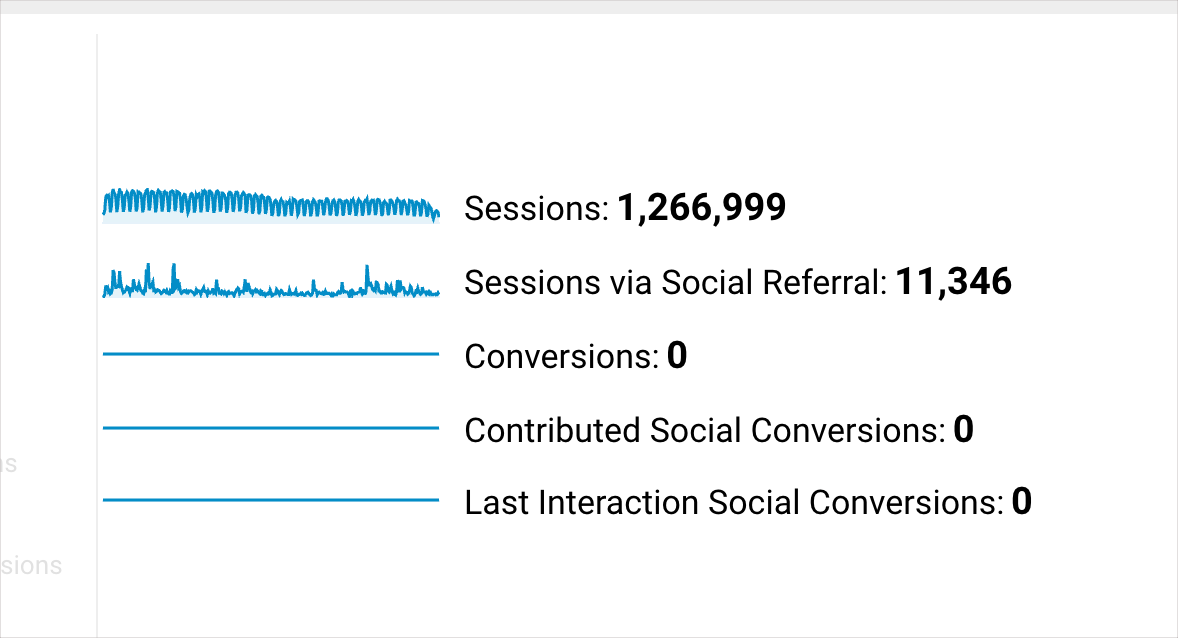
However, the percentage of traffic from all social media sources only accounts for 11,346 sessions from 1,266,999 total sessions (less than 1% of overall traffic), so this is just one drop in a bucket.
Organic search results have always dominated traffic origination, accounting for 90% of overall traffic. Yet social media seems to play into our psychology more prominently, giving us the sense of having content go viral. In reality, my most read page is this page from my API doc course: Step 3: Parameters (API reference tutorial). This page did not go viral on Twitter.
Analyzing metrics makes me wonder how worthwhile it is to spend time posting on social media channels. It’s probably more strategic to look at content driving organic traffic, then investing in SEO.
Confusing “Users” versus “New Users” metrics
There’s one metric that doesn’t make much sense to me: Users versus New Users. Apparently, over the course of an entire year, only 450 users returned. Everyone else was a new user:
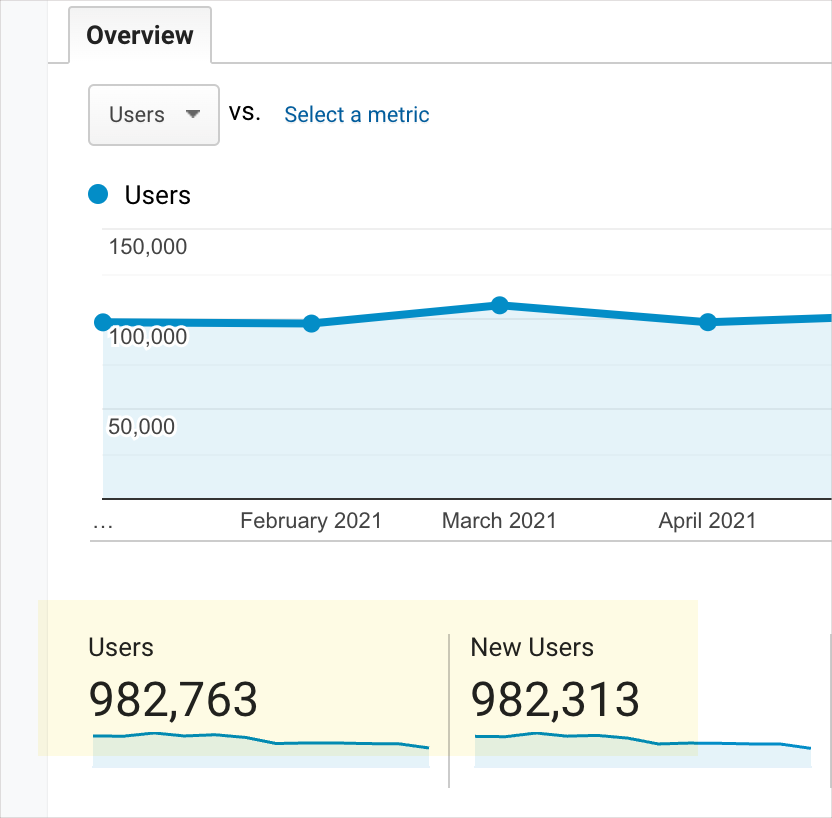
Unless readers are frequently clearing their cookies, using plugins to prevent any sort of tracking, surfing in incognito mode, reading at midnight (when sessions expire), or constantly switching browsers, I can’t understand this metric. Only 450 people made subsequent visits to my site in 2021? If so, Mark Baker’s mantra “Every page is page one” might better be rendered as “Every user is a first-time visitor.”
The data is further complicated by introducing “New Visitor” and “Returning Visitor” with conflicting numbers.
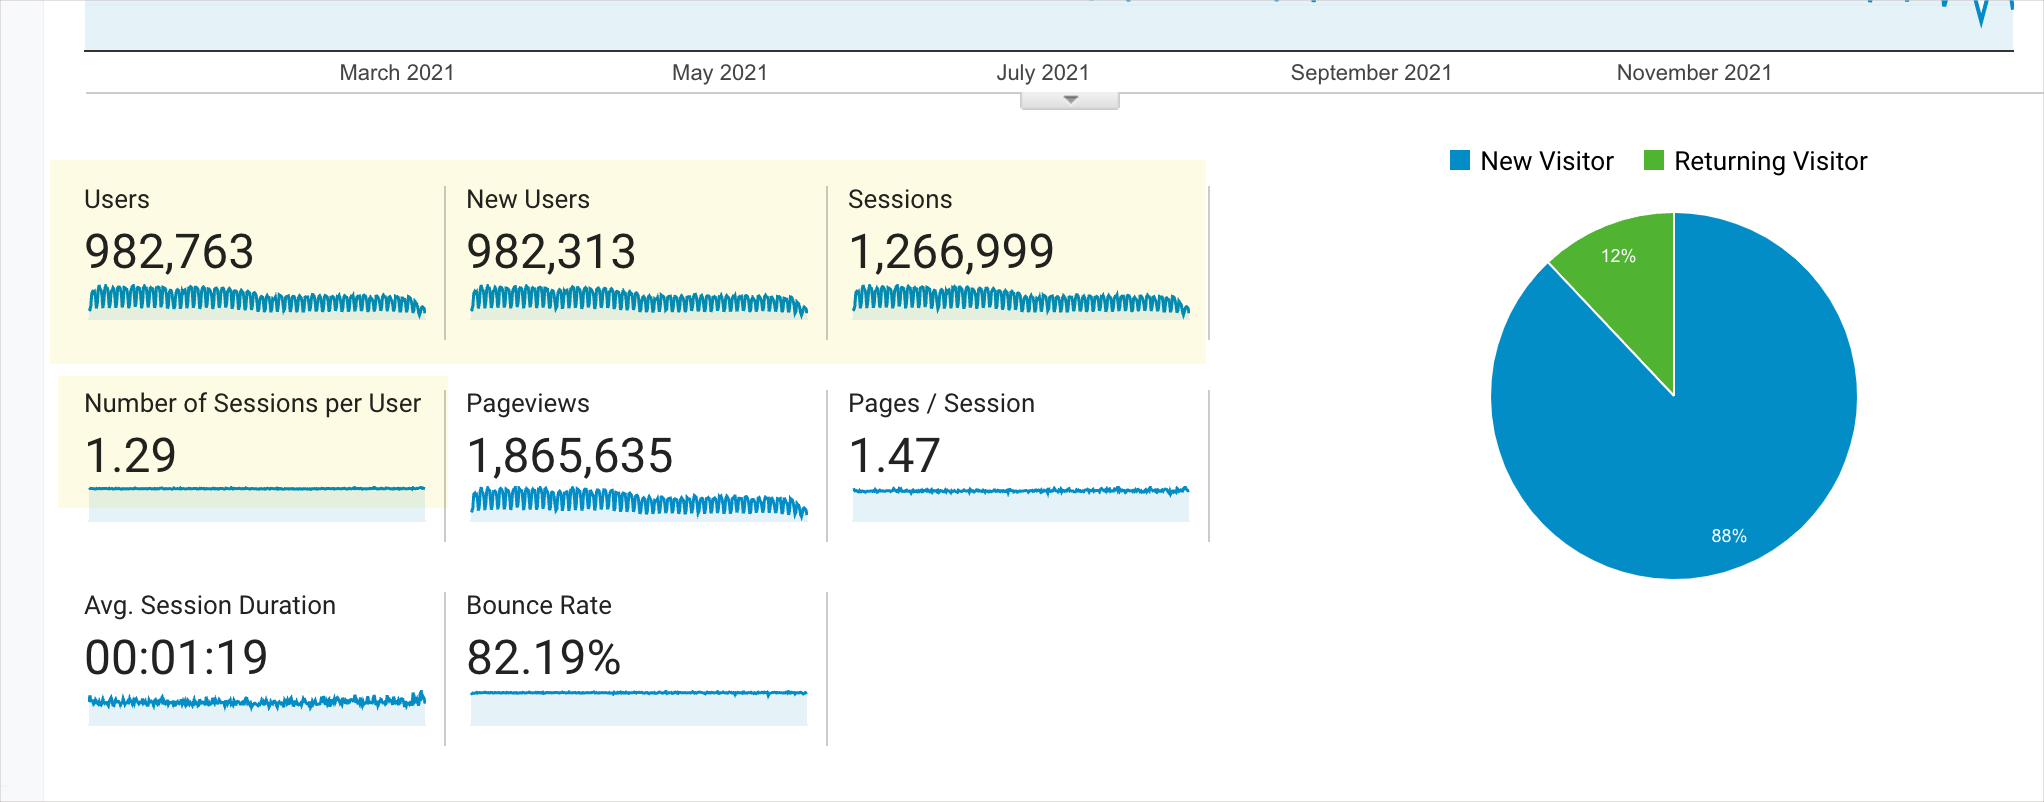
If Users and New Users are about the same, how can the average number of sessions per user be 1.29? Wouldn’t those additional .29 sessions be counted as “returning users/visitors”? If so, assuming 982,313 total users, that would mean about 285,000 returning users.
At this point, I sort of shrug my shoulders and wonder if pursuing the answer, no doubt convoluted, is worth it. I’m sure the real answer is complex.
Times of day and location
Here’s another interesting metric about traffic correlated with time of day and traffic by country:
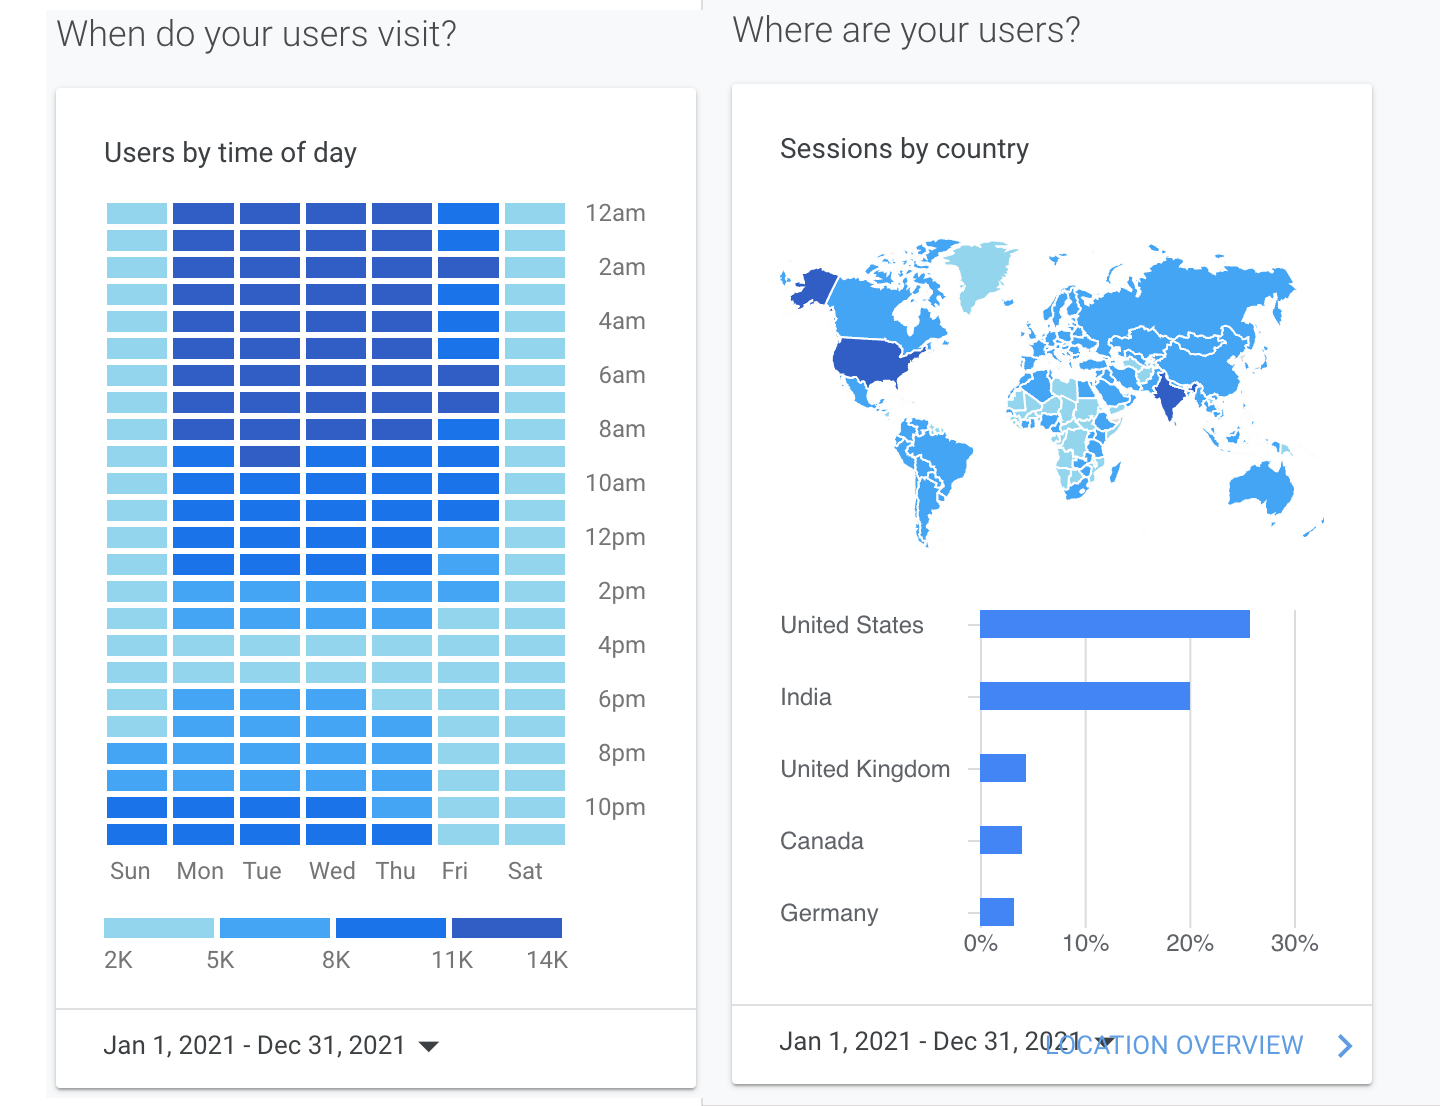
Most people tend to read content in the morning, with some reading at night. I’m in the Pacific time zone, so it might make more sense for me to send my newsletter right before bed rather than first thing in the morning.
Also, India! Wow, I nearly have as many readers from India as from the United States. What a growing juggernaut of a tech country. Perhaps I should get a better understanding of the tech comm scene in India. I did once present a keynote in Bangalore as part of tcworld 2015, and I really enjoyed the experience. (I posted my thoughts here after the conference.)
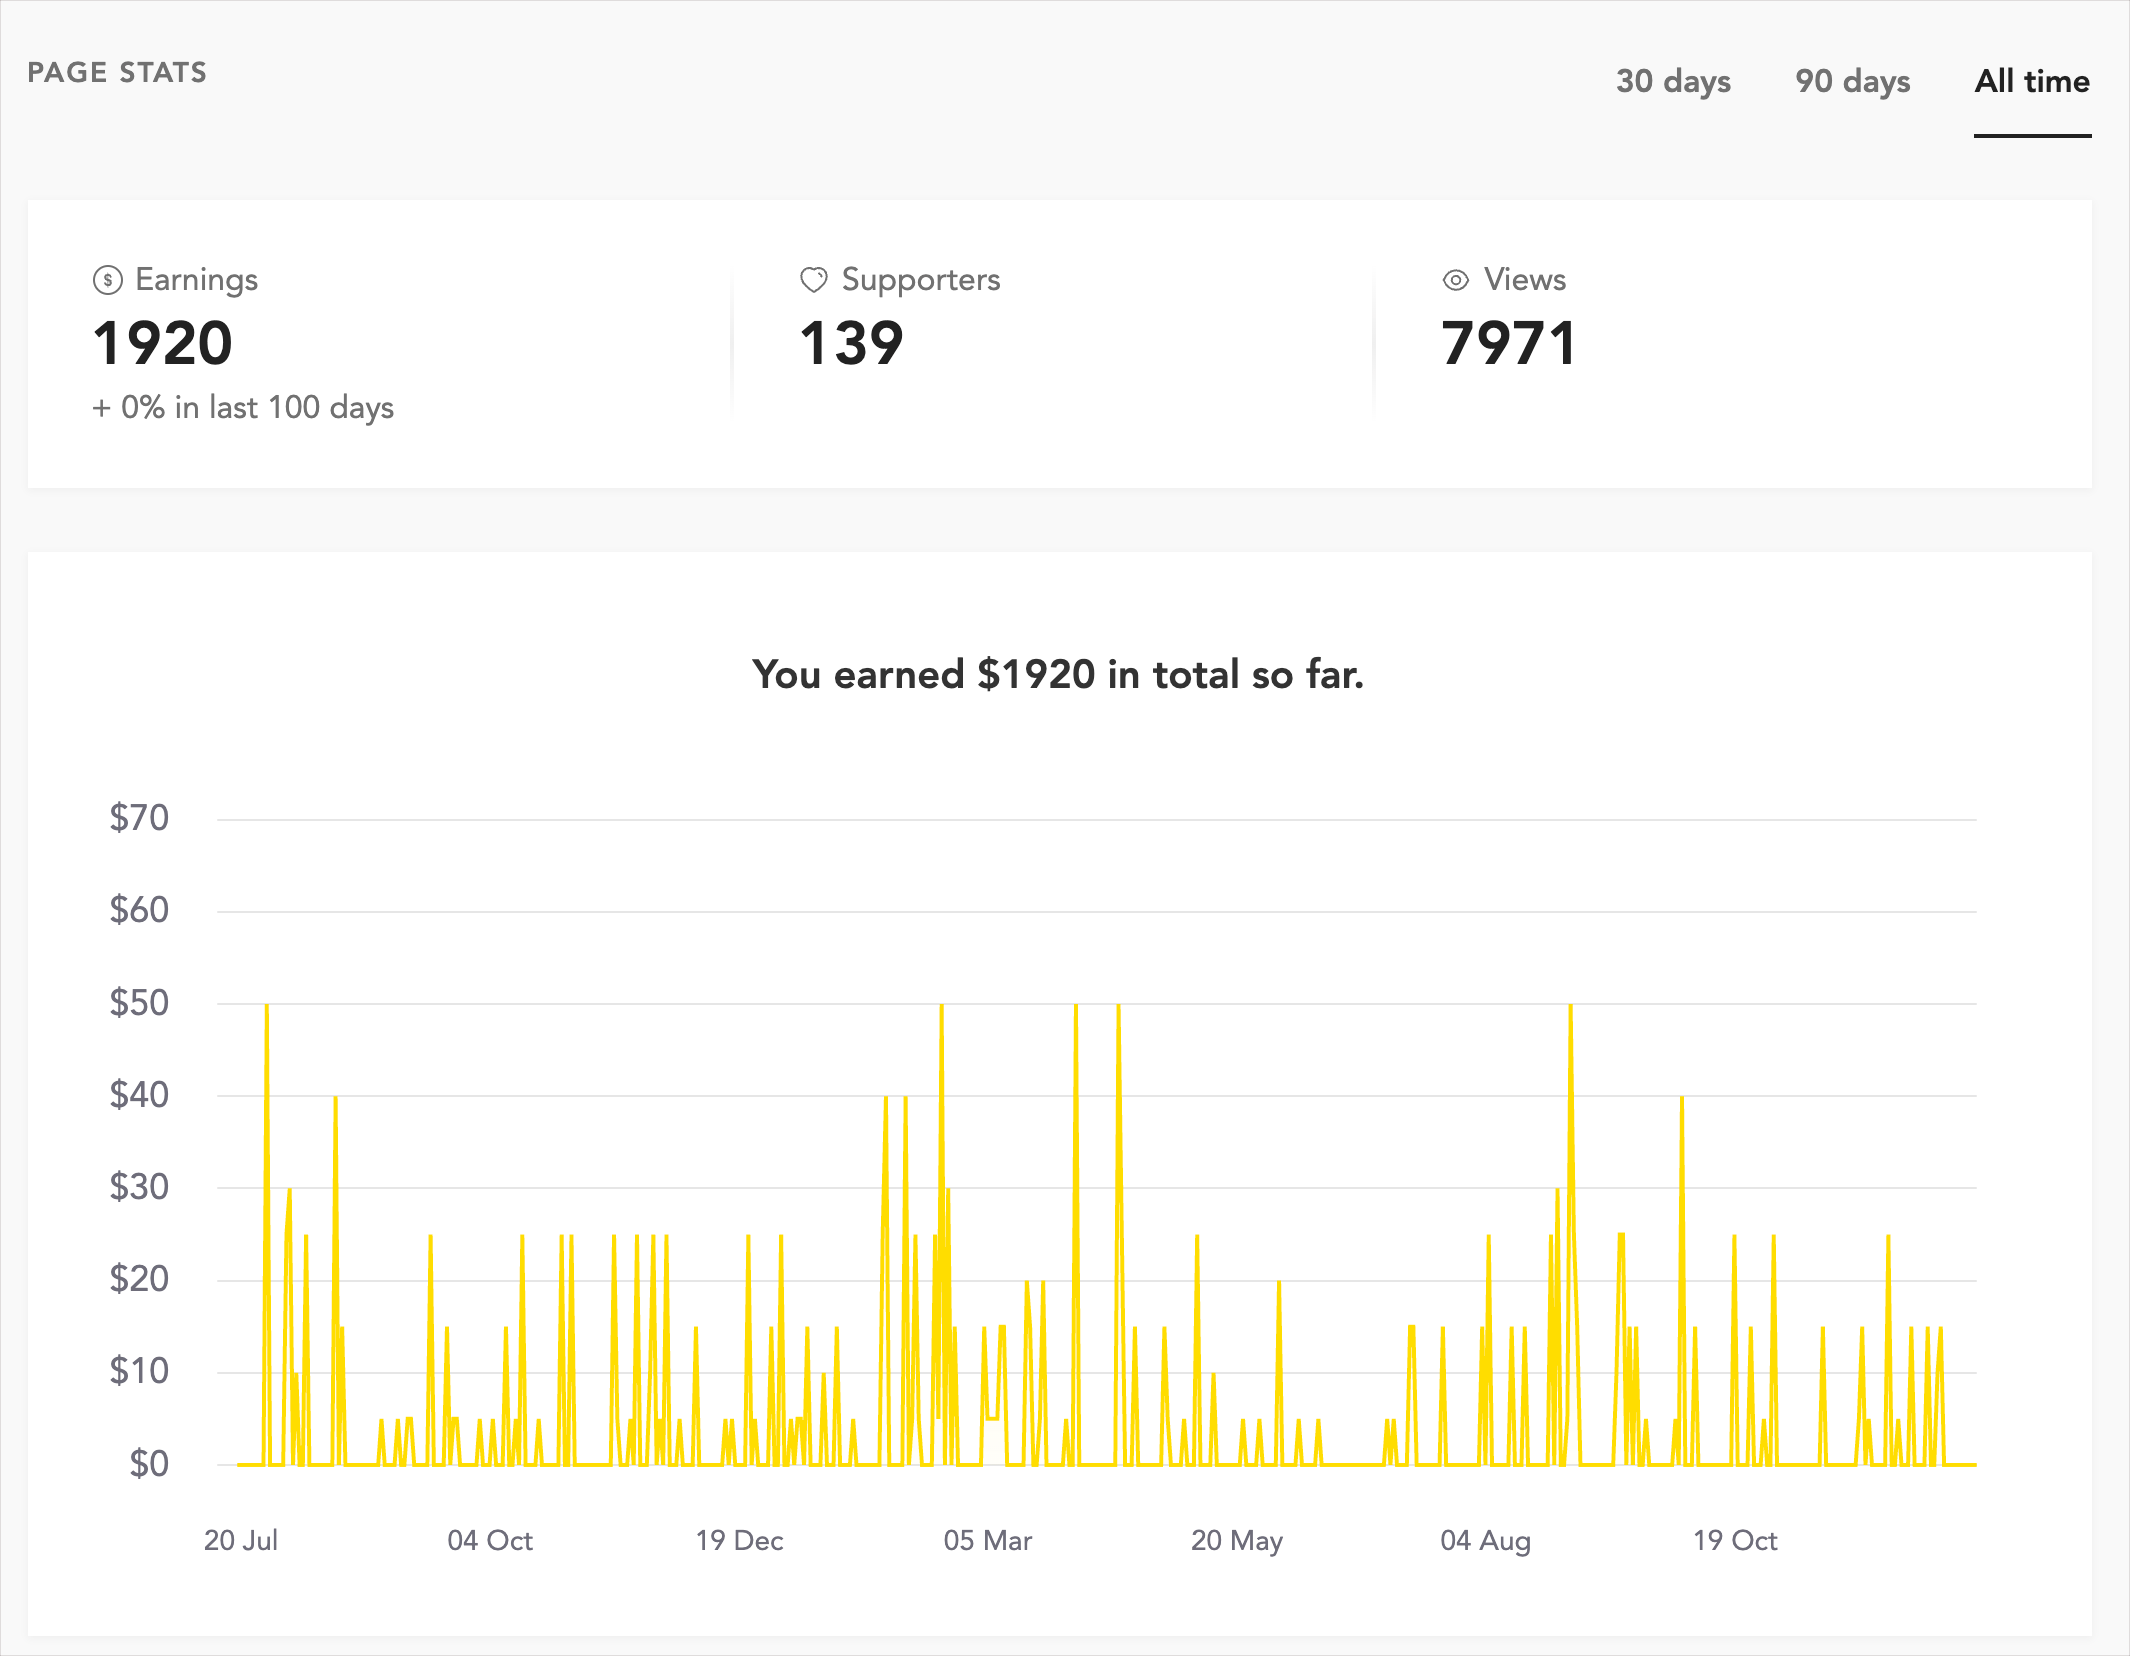
Finally (and this is outside of Google Analytics), in July 2020 I added a Buy me a coffee button on my site. From July 2020 through Dec 31, 2021, there were 139 supporters who donated a collective total of $1,920:
Overall takeaways
Here are my overall takeaways:
- I need to post more this year and be more active online. I should focus on shorter, more frequent content.
- API docs are still driving most of the traffic on my site. However, I’m not so sure that simply posting content that isn’t API-doc specific (just related to dev docs) in /learnapidoc actually makes it more visible. Most people don’t usually read more than 1.5 pages per session.
- Investing in SEO makes the most sense for increasing traffic.
- Sharing content early in the morning has the best engagement.
- YouTube is a growing source of traffic on social.
- For most traffic by country, India is only slightly behind the US.
About Tom Johnson

I'm an API technical writer based in the Seattle area. On this blog, I write about topics related to technical writing and communication — such as software documentation, API documentation, AI, information architecture, content strategy, writing processes, plain language, tech comm careers, and more. Check out my API documentation course if you're looking for more info about documenting APIs. Or see my posts on AI and AI course section for more on the latest in AI and tech comm.
If you're a technical writer and want to keep on top of the latest trends in the tech comm, be sure to subscribe to email updates below. You can also learn more about me or contact me. Finally, note that the opinions I express on my blog are my own points of view, not that of my employer.