

Site analytics
This page provides site analytics for my site. Each year in January, I gather up these analytics to analyze trends and plan content directions.
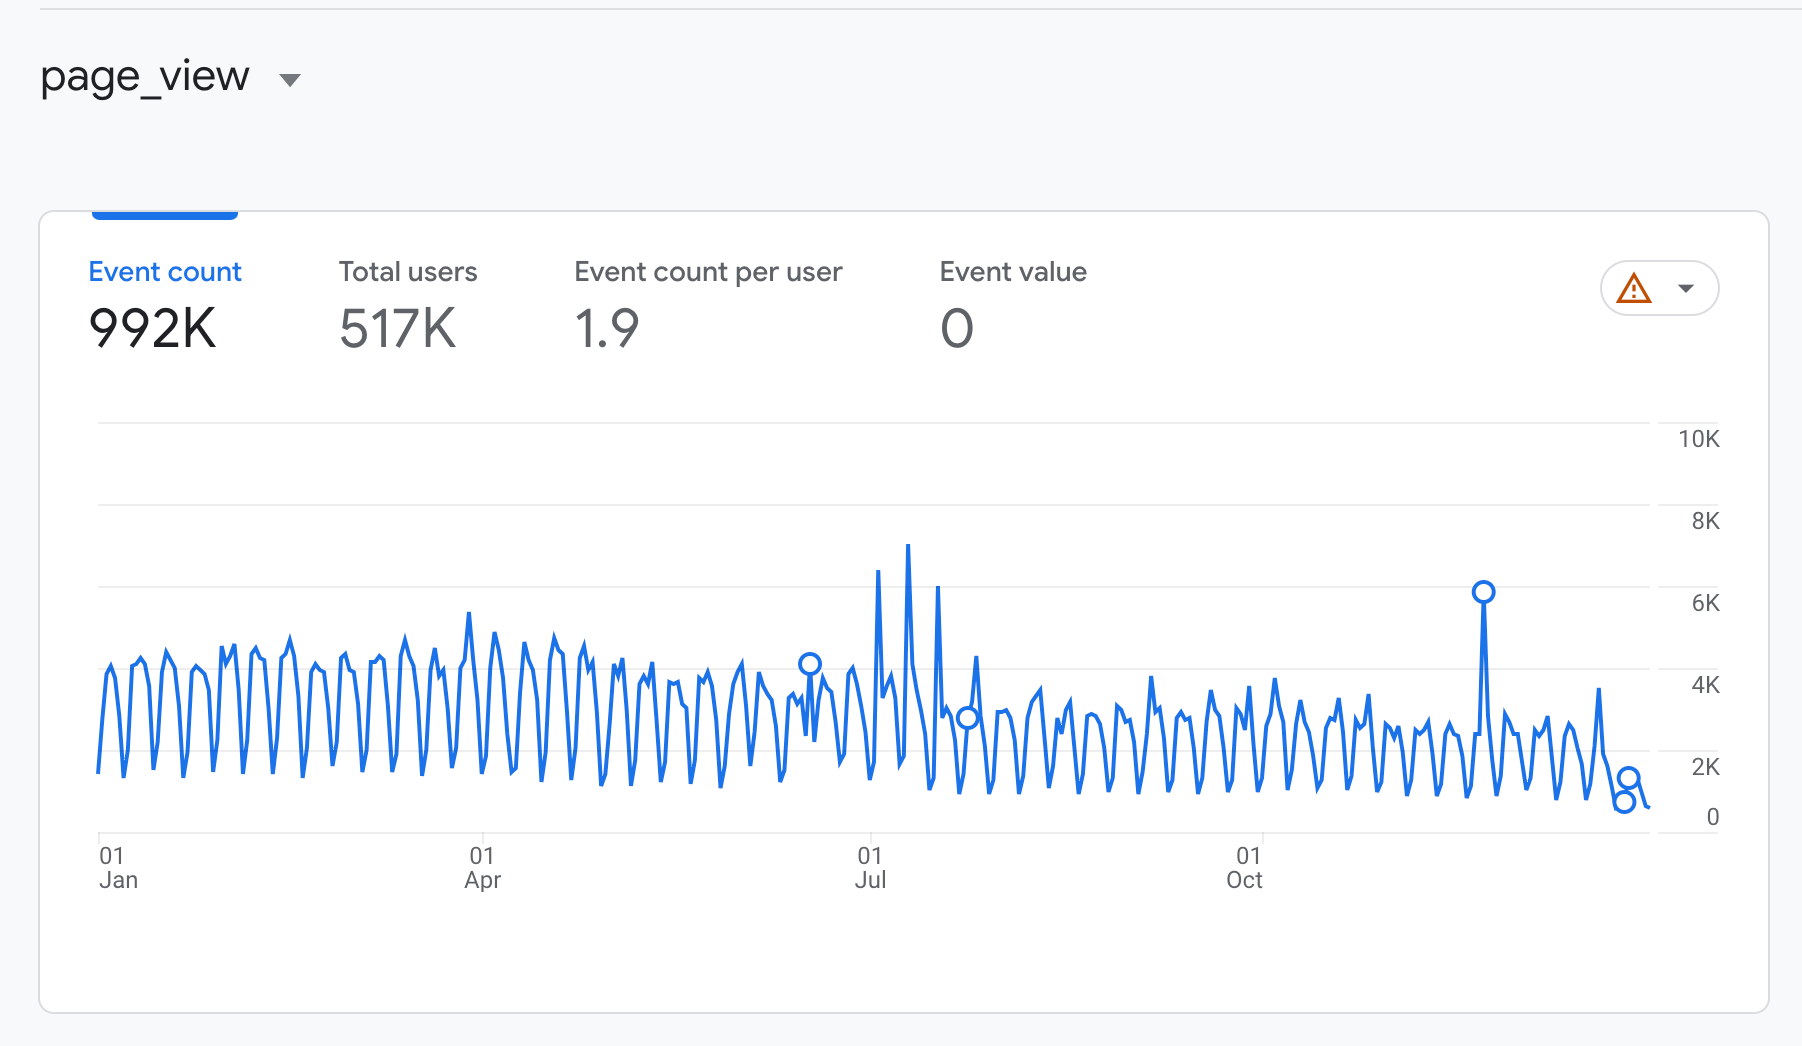
Here’s a screenshot of site traffic analytics on idratherbewriting.com for 2023 according to Google Analytics.
Overall page traffic
In 2023, idratherbewriting.com had 992,255 page views, or about 2,719 page views a day. More details are in the following table:
| Metric | Value |
|---|---|
| Pageviews | 992,255 |
| Average engagement time | 1:18 minutes |
| User sessions | 782,783 |
| Users | 517,954 |
| Sessions per user | 1.3 |
A "page view" is when the page loads, regardless of whether it's the same visitor or a different visitor. A "session" refers to a unique visit to the site. If the same visitor views 10 pages, it only counts as a single session.
Trends over time (2019 through 2023)
This section compares the same values for the past five years, providing a sense of trends over time. The percentage change from the previous year is listed in parentheses after the value.
| Metric | 2019 | 2020 | 2021 | 2022 | 2023 |
|---|---|---|---|---|---|
| Page views | 1,974,524 | 1,814,770 (-8%) | 1,865,635 (+3%) | 1,535,622 (-18%) | 992,255(-35%) |
| Average page views per day | 5,409 | 4,971 (-8%) | 5,111 (+3%) | 4,207 (-18%) | 2,719 (-35%) |
| Users | 909,236 | 916,922 (+1%) | 982,313 (+7%) | 820,365 (-17%) | 517,954 (-37%) |
| Sessions | 1,207,264 | 1,195,729 (-1.0%) | 1,266,999 (+6.0%) | 1,068,404 (-15.7%) | 782,783 (-27%) |
| Average engagement time* | 1:41 | 1:25 (-16%) | 1:19 (-7%) | 1:16 (-34%) | 1:18 (+3%) |
| Page views per session | 1.64 | 1.52 (-7.3%) | 1.47 (-3.3%) | 1.44 (-2.0%) | 1.27 (-12%) |
Locations
| Location | 2019 | 2020 | 2021 | 2022 | 2023 |
|---|---|---|---|---|---|
| US | 32% | 29% (-9%) | 25% (-14%) | 28% (+12%) | 31% (+11%) |
| India | 17% | 19% (+12%) | 20% (+5%) | 17% (-15%) | 15% (-12%) |
| UK | 5% | 5% (0.0%) | 4% (-20%) | 4% (0%) | 5% (+25%) |
Browsers
| Browser | 2019 | 2020 | 2021 | 2022 | 2023 |
|---|---|---|---|---|---|
| Chrome | 76% | 78% (+3%) | 77% (-1%) | 73% (-5%) | 67% (-8%) |
| Safari | 8% | 8% (0%) | 9% (+13%) | 12% (+33%) | 11% (-8%) |
| Edge | 2% | 3% (+50%) | 5% (+67%) | 6% (+20%) | 6% (0%) |
| Firefox | 9% | 8% (-11%) | 7% (-13%) | 6% (-14%) | 5% (-17%) |
Device types
| Device type | 2019 | 2020 | 2021 | 2022 | 2023 |
|---|---|---|---|---|---|
| Desktop | 88% | 88% | 86% (-2.3%) | 82% (-4.7%) | 84% (+2%) |
| Mobile | 11% | 12% (+9.1%) | 14% (+16.7%) | 18% (+28.6%) | 16% (-11%) |
Traffic origins — organic and social referrals
| Traffic Origin | 2019 | 2020 | 2021 | 2022 | 2023 |
|---|---|---|---|---|---|
| User sessions | 1,207,264 | 1,195,729 | 1,266,999 | 1,068,404 | 782,783 |
| Organic Search Traffic | 85% | 89% (+4.7%) | 90% (+1.1%) | 81% (-9.1%) | 72% (-11%) |
| Sessions via Social Referral | 11,163 | 13,840 (+24%) | 11,346 (+2%) | 48,018 (+3,960%) | 56,327 (17%) |
Top 30 pages
About 50% of the traffic goes to my [API doc site](/learnapidoc). Looking at the top 30 pages of my site, the API documentation pages top the list, even though there are about 100 course pages and 3,000 blog pages.Previous posts analyzing site analytics
For more details about analytics, see the following posts. These posts expand on audience interests and demographics.
- 2023 - My site analytics for 2023
- 2022 - Meandering thoughts on my 2022 site analytics
- 2021 — Site analytics for 2021
- 2020 — Site analytics for 2020 – trends, reflections, and thoughts
- 2019 — Reflections on my 2019 site analytics
- 2018 — Site analytics from Jan 1 to Dec 31, 2018 – are more engineers writing docs now?
- 2017 — Unexpected realizations after a comprehensive review of my 2017 site metrics
- 2016 — Analyzing top posts on my blog during 2015 —- Deciding between brand versus readership
- 2015 — Top 10 posts, podcasts, tweets of 2014 – and what it all means
About Tom Johnson

I'm an API technical writer based in the Seattle area. On this blog, I write about topics related to technical writing and communication — such as software documentation, API documentation, AI, information architecture, content strategy, writing processes, plain language, tech comm careers, and more. Check out my API documentation course if you're looking for more info about documenting APIs. Or see my posts on AI and AI course section for more on the latest in AI and tech comm.
If you're a technical writer and want to keep on top of the latest trends in the tech comm, be sure to subscribe to email updates below. You can also learn more about me or contact me. Finally, note that the opinions I express on my blog are my own points of view, not that of my employer.