

Unexpected realizations after a comprehensive review of my 2017 site metrics
- Number of page views and sessions
- Audience demographics
- Comparison of metrics to 2016
- Top 10 2017 posts
- Top 10 posts of all time
- Top 10 pages on API documentation site
- Top 10 pages (not posts, nor pages from API doc site)
- Top 10 podcasts
- Number of posts written
- Percent of traffic to API doc site versus regular site
- Top 10 most-linked-to pages
- Top 25 search queries
- Visits to Jekyll theme
- Conclusions
- Realization #1: These 7 topics matter most to technical communicators
- Realization #2: Popular post titles include contrarian trigger words
- Realization #3: The ideal content length is … long (1,600+ words)
- Realization #4: Organic search trumps social media likes and retweets but lacks addictive checking behaviors
- What common form or technique emerged in popular posts?
- End summary
- Similar posts
If you want to skip over the data details, jump down to the Conclusions.
Number of page views and sessions
From Jan 1, 2017, to Dec 31, 2017, idratherbewriting.com had about 845,000 page views. Here’s a chart from Google Analytics.
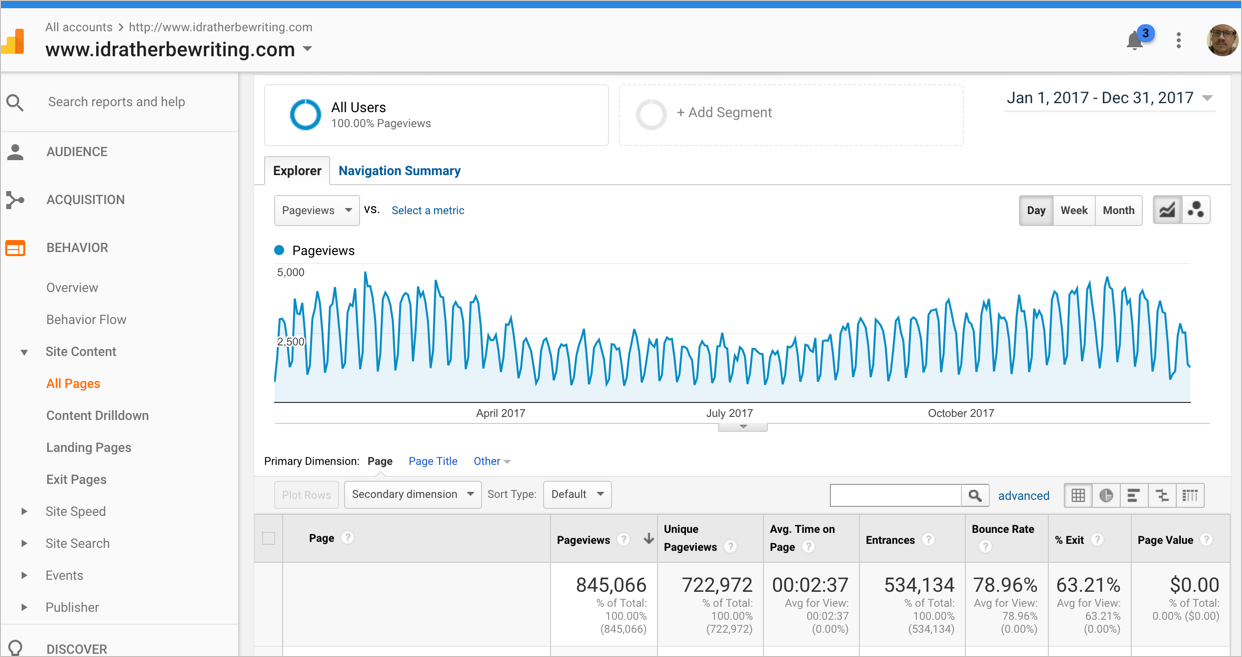
(There was a slight dip mid-year because I split out the API doc site into a separate Jekyll project and didn’t have analytics configured correctly for a couple of months.)
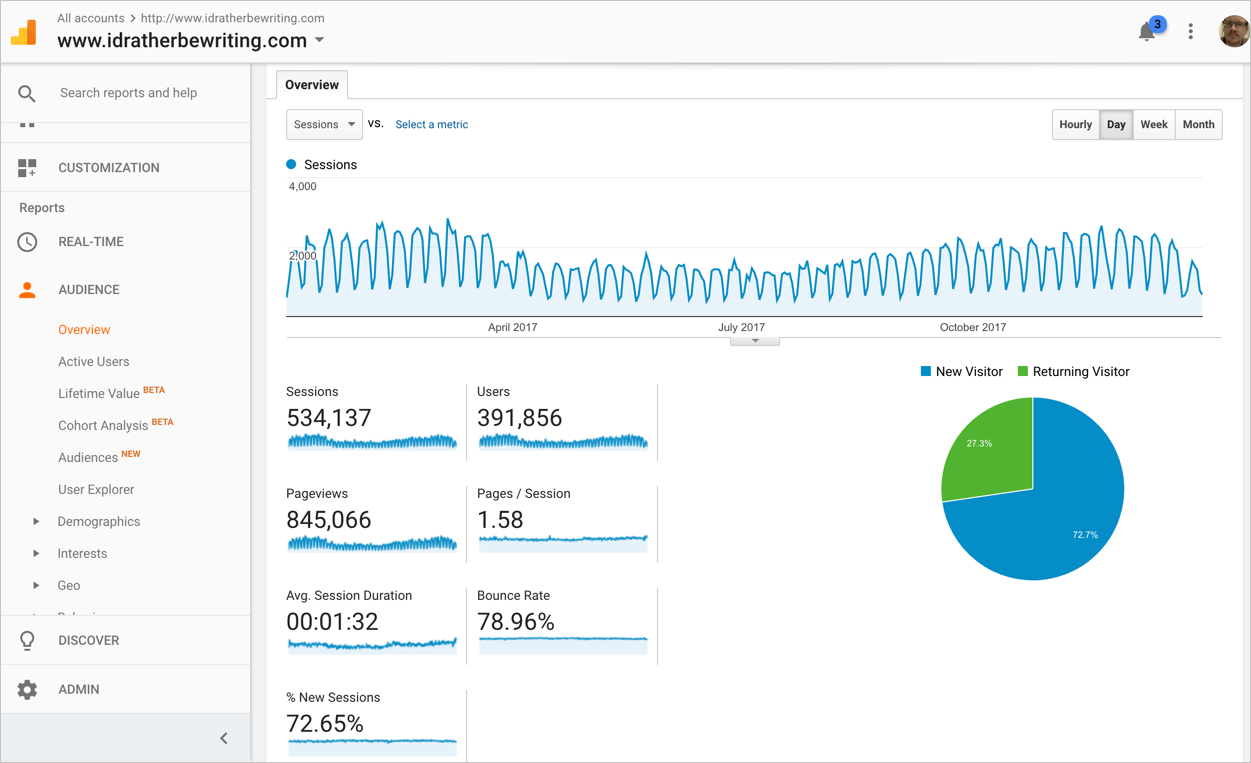
Here’s another slice of analytics focusing more on audience:
The following table shows the metrics from the charts plus some additional detail.
| Jan 1, 2017 to Dec 31, 2017 | Number |
|---|---|
| Page Views | 845,000 (about 2,300 page views a day) |
| Sessions (unique visitors) | 534,000 |
| Pages per session | 1.58 |
| Bounce rate (visitors who viewed one page only) | 79% |
| Average time on page | 2:37 minutes |
| New users | 392,000 |
| Acquisition of sessions from Google search | 73% |
| Acquisition of sessions from social media | 2% Twitter (3.1k), Linkedin (2.7k), Facebook (1.4k) |
| Acquisition of sessions from direct URLs | 17% |
Audience demographics
Google Analytics indicates the following about audience demographics for 2017:
- 74% of readers read US English language, 10% read Great Britain English
- 42% of readers originate from US, 12% from India, 6% from UK, 5% from Canada, 3% from Germany, 2% from Australia
- Top US cities are New York, Boston, San Francisco
- Top non-US cities are Bangalore, Toronto, London, Hyderabad, Pune, Chennai
- Top browsers are Chrome (67%), Safari (11%), Firefox (10%), Internet Explorer (7%)
- Top operating systems are Windows (60%), Mac (19%), iOS (8%), Android (8%)
- 34% of readers are male, 66% are female
- 18% of readers are 18-24 yrs old, 40% of readers are 25-34 yrs old, 25% are 35-44
- Most readers are technophiles, shutterbugs, business professionals, movie lovers, and value shoppers (based on Google’s “affinity categories”)
In sum, the average reader is a 30-year-old female living in New York using Chrome on a Windows PC who identifies as a technophile.
Comparison of metrics to 2016
How did the metrics compare to the previous year? They’re up a bit:
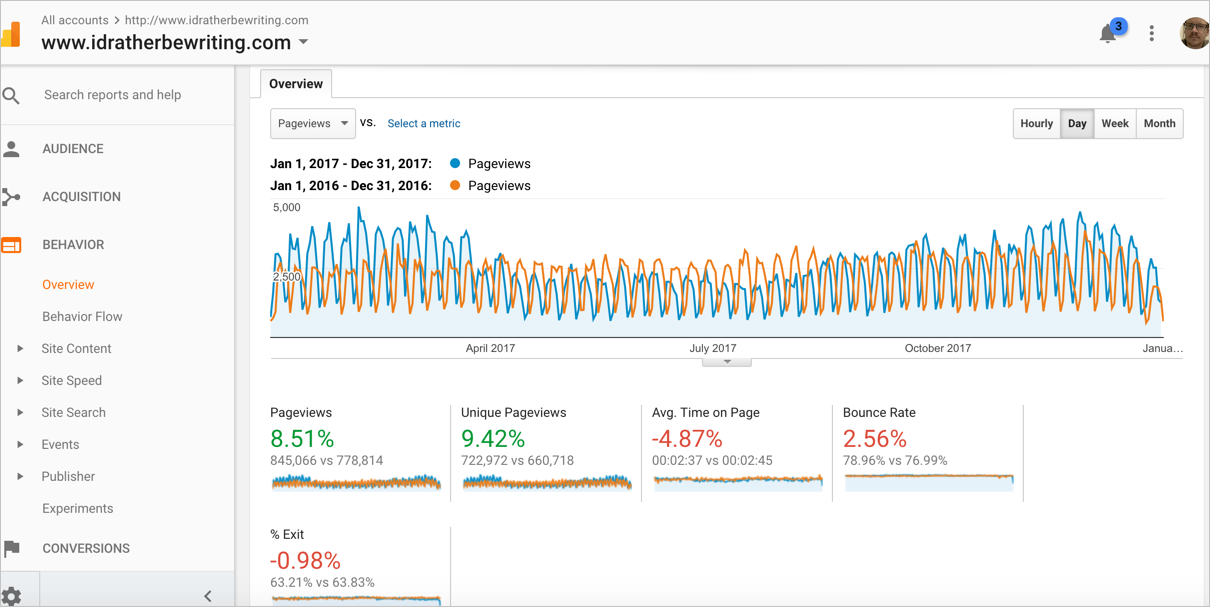
There were at least 66,000 more page views in 2017 than in 2016.
Top 10 2017 posts
These were the most viewed posts in 2017:
- Technical Writing Trends and Predictions for 2017 (1,952 words, no graphic)
- Amazon begins pilot with voice-interactive user manuals (1,334 words, graphics)
- The problem with Frequently Asked Questions (FAQs) in documentation (1,281 words, graphics)
- Tech docs and Agile: Problems with integrating tech writers into engineering Scrums (Part 1) (4,293 words, podcast)
- How do you learn what you need to learn to be successful as a technical writer? (2,695 words, podcast)
- Simplified Technical English and HyperSTE (1,163 words)
- Limits to the idea of treating docs as code (2,099 words, graphic)
- Tech docs and Agile: Alternatives to integrating into engineering Scrums (Part 2) (3,991 words, podcast)
- Why simple language isn’t so simple: the struggle to create plain language in documentation (4,023 words, graphic, podcast)
- Why Stack Overflow’s Documentation effort failed – a few thoughts from a technical writer’s perspective (1,676 words, podcast)
Average word count: 2,451
Top 10 posts of all time
These are the most viewed posts of all time (since I started blogging in 2006):
- 10 realizations as I was creating my Swagger spec and Swagger UI (2,615 words, graphics)
- Technical Writing Careers – Answering 13 Questions about Technical Writing Jobs (1,988 words)
- Quick Reference Guides: Short and Sweet Documentation (3,135 words, no graphics)
- Swagger tutorial for REST API documentation (routing page only, not really a post.)
- Are Certificate Programs Helpful for Transitioning into Technical Writing? (562 words, graphic)
- The Name of Your Department Does Matter (623 words)
- Five Skills Every Technical Writer Needs (524 words)
- Technical Writing Trends and Predictions for 2017 (1,940 words)
- Quick Reference Guide Formats – Tips for Finding Attractive Layouts (346 words)
- 40 Foundational Books for Technical Writing (1,300 words)
These posts are largely the same as in 2016.
Average word count: 1,448
Average word count between top 10 posts in 2017 and top 10 posts of all time: 1,950 words
Top 10 pages on API documentation site
These are the top 10 pages on my API documentation site.
- Swagger UI tutorial (1,954 words, graphics)
- Documenting APIs: A guide for technical writers (1,265 words, graphics)
- Submit requests through Postman (1,371 words, graphics)
- Introduction to the OpenAPI specification and Swagger (3,997 words, graphics)
- Overview of REST API specification formats (566 words)
- Use the JSON from the response payload (1,008 words, graphics)
- Flickr example: Retrieve a Flickr gallery (1,256 words, graphics)
- Step 3: Parameters (API reference tutorial) (2,014 words, graphics)
- OpenAPI 3.0 tutorial overview (1,498 words)
- RAML tutorial (1,580 words, graphics)
Average word count: 1,651 words
Top 10 pages (not posts, nor pages from API doc site)
These are the top 10 pages on my site altogether, excluding blog posts and excluding pages from the API documentation site.
- Quick Reference Guide Templates (989 words, graphics)
- JavaScript: Events and Listeners (967 words)
- Beginners category (not a post)
- About me (815 words, graphics)
- Contact me (not a post)
- About Jekyll (252 words)
- Java: Share files with others using Git and Github (632 words)
- Podcasts category (not a post)
- Java: Javadoc tags (2,065 words)
- Introduction to User-Centered Documentation (501 words, graphics)
Average word count: 889 words
Average word count between top 10 pages on the API doc site and top 10 pages on the blog: 1,270.
Top 10 podcasts
These were my top 10 podcasts.
- Tech docs and Agile: Problems with integrating tech writers into engineering Scrums (Part 1) (2,675 downloads, 35:03 min.)
- Recording of User-Centered Design Principles for Organizing Documentation (2,269 downloads, 57:58 min.)
- Why simple language isn’t so simple: the struggle to create plain language in documentation (2,055 downloads, 30:11 min.)
- Tech docs and Agile: Alternatives to integrating into engineering Scrums (Part 2) (1,949 downloads, 31:07 min.)
- Why Stack Overflow’s Documentation effort failed – a few thoughts from a technical writer’s perspective (1,754 downloads, 12:08 min.)
- When the pain of ignorance exceeds the pain of learning (1,734 downloads, 17:51 min.)
- Has plain language deepened or ruined our delight in language? (1,733 downloads, 18:06 min.)
- Recording: Modern Technical Writing, by Andrew Etter (STC Silicon Valley chapter) (1,456 downloads, 1:02:00 min.)
- Recording: Writing tech docs like a hacker with Jekyll (1,519 downloads, 59:18 min.)
- Transparency in documentation: dealing with limits about what you can and cannot say (1,198 downloads, 18:27 min.)
Average length: 32 min.
The Write the Docs podcasts didn’t have nearly as many hits. The highest show, Write the Docs Podcast #3 - Trends for 2017, had just 587 downloads. The average number of downloads was 300-400 per episode.
I didn’t realize that, for a popular podcast, all you really need to do is read your posts.
Number of posts written
I wrote just 72 posts this year. In 2016, I wrote 96 posts. In 2015, I wrote 145 posts. In 2014, I wrote 117 posts. In 2013, I wrote 88 posts. However, I probably added 25 pages to my API documentation site this year, so the numbers probably balance out.
Percent of traffic to API doc site versus regular site
In 2017, my API documentation site received 309,000 visits out of the 845,000 overall visits. This is about 36% of the traffic to my site.
Top 10 most-linked-to pages
There are 35,408 backlinks pointing to my site. Pages with the most links pointing to them are as follows:
- I’d Rather Be Writing (homepage) (18,876 backlinks, not a post)
- Jekyll category (not a post)
- Jekyll Documentation Theme (1,151 backlinks, 2,576 words)
- Misconceptions about Topic-Based Authoring (703 backlinks, 1,970 words)
- Why is TC Camp’s unconference format so popular? Interview with Liz Fraley, TC Camp Founder (359 backlinks, 1,739 words)
- Discoveries and realizations while walking down the Docs-as-Code path (294 backlinks, 3,342 words)
- About me (286 backlinks, 815 words)
- Why Stack Overflow’s Documentation effort failed – a few thoughts from a technical writer’s perspective (255 backlinks, 1,676 words)
- Convert Google Docs content to Markdown or HTML using the gd2md-html add-on (235 backlinks, 345 words)
- Translating with the New Madcap Lingo V2 (215 backlinks, 940 words)
Average word count: 1,490
There are 2,467 URLs indexed on my site. (By the way, these particular backlink stats come from Google webmaster tools.)
Top 25 search queries
These are the top queries and clicks:
- 1 swagger tutorial (1,212 clicks)
- 2 swagger (527 clicks)
- 3 swagger ui (258 clicks)
- 4 swagger ui tutorial (220 clicks)
- 5 swagger api tutorial (202 clicks)
- 6 swagger example (173 clicks)
- 7 technical writing certification (137 clicks)
- 8 swagger ui example (111 clicks)
- 9 quick reference guide (99 clicks)
- 10 swagger api (95 clicks)
- 11 i’d rather be writing (92 clicks)
- 12 technical writing skills (92 clicks)
- 13 swagger api example (87 clicks)
- 14 idratherbewriting (87 clicks)
- 15 how to use swagger (83 clicks)
- 16 jekyll documentation theme (72 clicks)
- 17 swagger documentation (63 clicks)
- 18 technical writer skills (60 clicks)
- 19 javascript event listener (57 clicks)
- 20 swagger rest api tutorial (48 clicks)
- 21 swagger documentation example (46 clicks)
- 22 swagger tutorial for beginners (46 clicks)
- 23 swagger api documentation (44 clicks)
- 24 dilbert principle (44 clicks)
- 25 api authorization (44 clicks)
It’s unfortunate that the OpenAPI initiative rebranded the Swagger spec as “OpenAPI.” It seems many people search for swagger, not OpenAPI. In choosing to use the “correct” terms for this space, I probably sacrificed a lot of potential hits.
Top countries performing searches:
- 1 United States (8,906 clicks)
- 2 India (3,857 clicks)
- 3 United Kingdom (1,194 clicks)
- 4 Canada (989 clicks)
- 5 Germany (833 clicks)
Visits to Jekyll theme
Mid-way through the year, I started tracking hits on my Jekyll documentation theme. There were 73,000 page views.
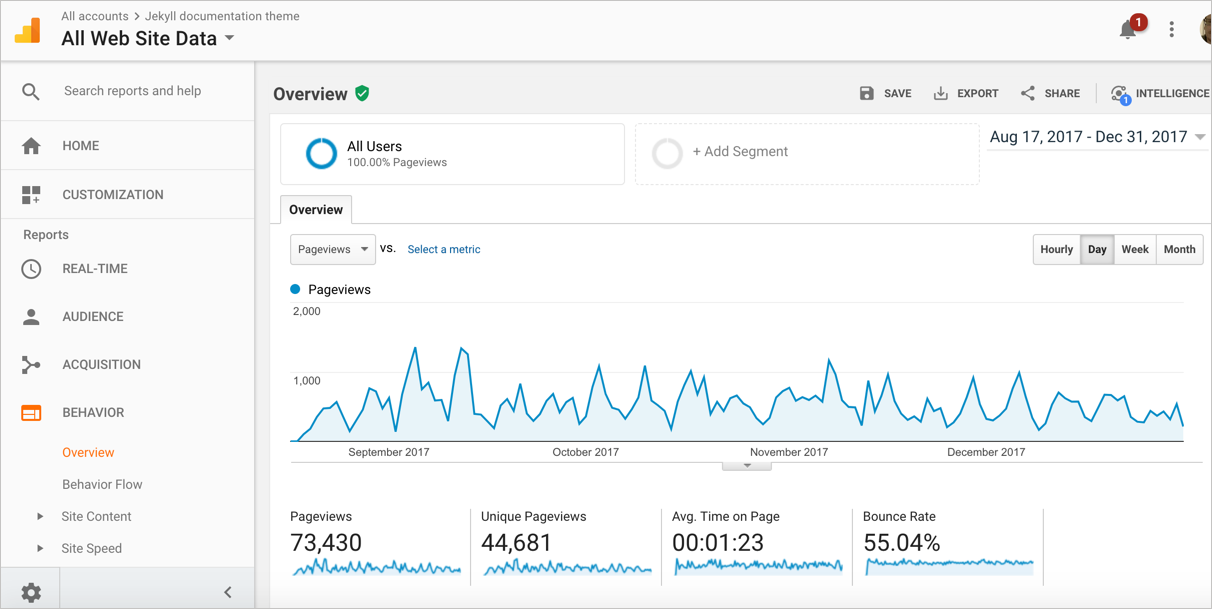
However, I’m not sure if these metrics are skewed because the theme gets forked and maybe people leave in the original Google Analytics code? At any rate, I have this analytics code separated out from my main analytics because I don’t display ads on this theme. Still, this is a considerable amount of traffic.
Conclusions
What conclusions can we gather from this data? For example, what topics are of most interest to technical writers and other documentation creators? What is the ideal post length? What characteristics do the most popular posts share? Do the most popular posts phrase their titles as questions, as Larry Kunz observed with his trending content? Do the titles contain other trigger words that generate immediate interest?
Now that we have actual data, let’s make a few simple observations.
Realization #1: These 7 topics matter most to technical communicators
These topics seem to matter most to technical communicators:
- Swagger
- Agile
- Trends
- Plain language
- Quick reference guides
- TC careers, certificate programs
- Learning
Why these topics? Maybe just as end-users search for answers related to their “pain points,” tech comm readers also search for answers to their pain points. Perhaps we have questions, challenges, or other issues with these topics that make them particularly [painfully] relevant.
Agile is a hot button for tech writers, probably because of all the problems tech writers face in trying to integrate into the agile flow. Swagger and OpenAPI specifications are hot topics too because they are confusing and difficult to implement. Writers care about language and simplicity yet probably struggle to capture the readability they feel capable of achieving. Topics for beginners are also popular no doubt because of the difficulty of breaking into the field.
(By the way, analytics data explains “what is,” not “why.” We supply the reasoning behind the data mostly through speculation.)
Given the popularity of these topics, should I focus my blog more squarely on these topics of high interest? If I wanted to increase site traffic, these techniques might build more readership, more search results clicks, and more overall visits. Throughout 2017, based on learnings from 2016, I did massively rewrite and expand on the Swagger and OpenAPI content in my API doc site. I focused a bit on agile and trends as well in blog posts.
But if I only write towards what’s popular, the trajectory of my content becomes more like an annoying tennis game where the players move one step closer to each other with each hit. For example, suppose based on my metrics, I write about what gets the most hits — trends. The new trends post goes viral and drives more traffic. I write another post on trends. Bang, even more hits. Now I’m getting asked to speak on trends and people perceive me as a trends expert. In time, my blog is now reframed as “Technical Writing Trends.” When people think of technical writing trends, they think of Tom Johnson. Is that what I want? Which audience am I writing for? And what audience am I missing by not addressing other topics? What about all the readers for, say, science communication?
We write tech docs based on our user’s pain points, but at the same time, on this blog I am not necessarily writing for my readers. I write for myself. I ask questions that interest me. I explore topics I want to know more about. I explore areas I want to become more familiar with.
If it so happens that others have similar interests and questions, then great, we have a connection through our shared interest. That’s how niche communities on the Internet work. The potential audience online is vast enough that I don’t need to worry about what my readers care about. My affinity towards topics will pull out those niche readers from the cracks and crevices of the virtual earth (readers from Hyderabad to Malaysia to Greenland and more) who care about the same topics as I do. Those people searching for “context-sensitive help techniques for tab-based submission interfaces” will suddenly find a new information source in me. Maybe.
In 2018, I want to align myself with who I authentically am — in ways that I’ve never done before. This might involve me challenging more assumptions, being creatively introspective. Inside I am a curious, philosophically wandering sort of contrarian person. In 2018, I’d like to tease more of that curiosity out to the surface.
Last year, I had a similar debate about writing for “readership” or writing for “brand.” I concluded that writing for beginners (hence readership) would draw more traffic, but writing about API doc would establish my brand as an expert. I did the latter, and yes, it largely had the effect I wanted – all my posts about API doc has helped position me as an expert in this area.
Realization #2: Popular post titles include contrarian trigger words
Post titles with “realizations” and “failures” and “misconceptions” and “limits” (contrarian triggers) are popular. Why? People are intrigued by the proposition that what they previously thought to be true actually isn’t. Don’t we all like to have the tables turned on our sense of knowledge?
Does the data here mean that I should write more about swagger, agile, trends, plain language, TC careers, certificate programs, etc., and that I should work in the terms “realizations” and “misconceptions” and “failure” into each of these titles? For example:
- 5 misconceptions about tech writing certificate programs
- The failure of plain language
- Realizations of a tech comm agile scrum master
- 3 tech writing trends that failed
- What I realized in designing quick reference layouts
- Limits to my patience with engineers
Hmmm, I would click on each of these articles. So maybe there is something to this game. Put the right topic keywords with the right contrarian trigger words in your title, and you’ve got a great hook. I’m not sure how long game can last (linkbait titles have to actually deliver on the promise), but it might be fun. (Can you tell where I got the motivation for my current post’s title?)
In 2008, I observed that the most popular posts have lists in the titles, but I decided that making laundry lists of everything was artificial and suggested superficial thinking rather than deeper structured arguments (see Three Notable Characteristics of Top 10 Posts: Lists, Headings, Images).
Realization #3: The ideal content length is … long (1,600+ words)
I once read that the ideal length for the most popular posts was 1,600 words — see Clive Thompson on How Tweets and Texts Nurture In-Depth Analysis. This seemed to run against earlier advice about “optimized” lengths for online content, which typically put the recommended word length at around 500-800 words due to shorter online attention spans. Is the ideal length of online content really twice that?
I meticulously measured word counts for these more popular posts (1,950 words) and popular pages (1,270 words) and averaged them out. The average, 1,610 words, quite astonishingly corresponds with the 1,600-word-count recommendation. In The Ideal Length of Everything Online, Backed by Research, the authors analyzed nearly 600 posts on Medium to determine the reading length of the most popular articles. They found:
… an ideal blog post would be one that people read. And Medium’s research on this front says that the ideal blog post is seven minutes long. … in terms of word count, a 7-minute read comes in around 1,600 words.
They depicted this with a graphic:
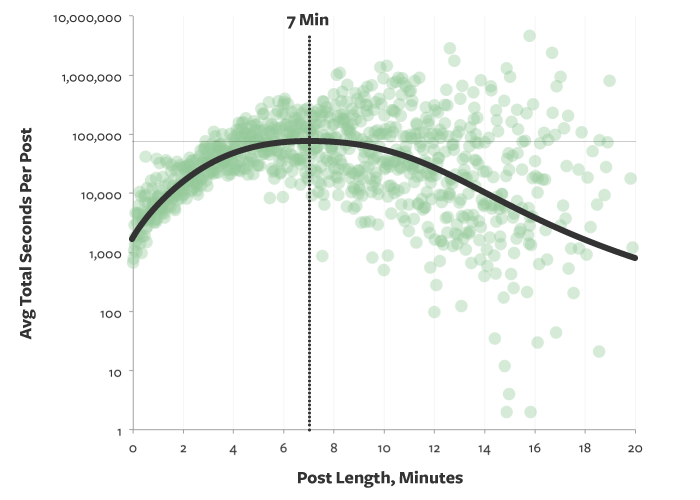
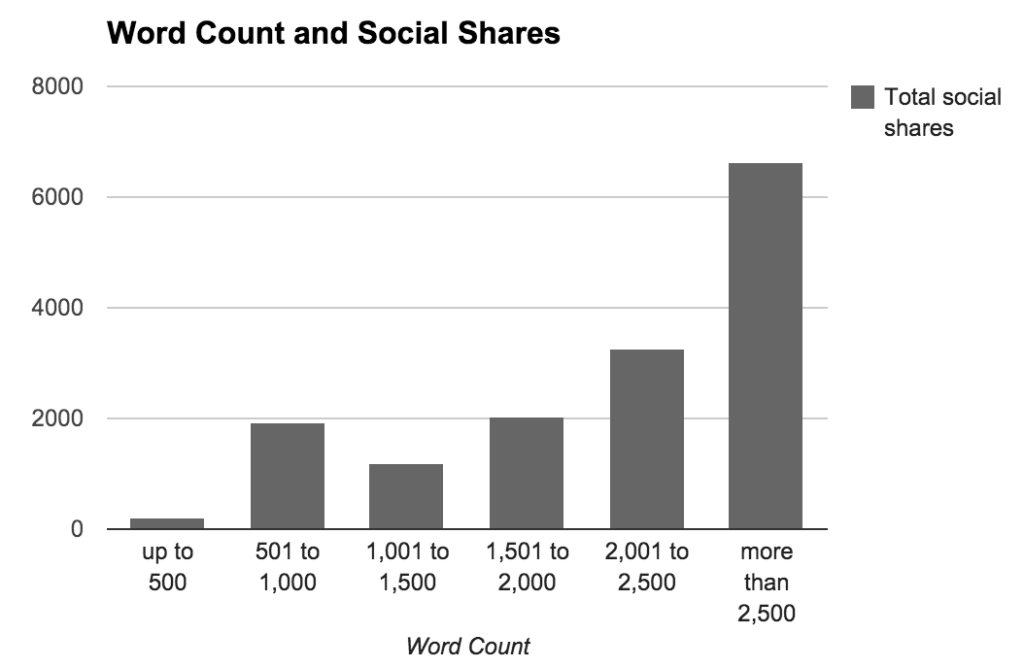
They followed up this post with another updated post, this one based on blog content audit of 595 posts. They found:
1,600 words makes for a good guideline to get started.
We’ve found that 2,500-word posts tend to do best for us.
Here’s their graphic:
A few years ago, I engaged in endless debates about the ideal length of content for documentation. See these posts as examples of the content length debate:
- Why Long Topics Are Better for the User
- Do Short Topics Make Information More Findable?
- Does DITA Encourage Authors to Fragment Information into a Million Little Pieces? (this one, by the way, generated a ton of controversy)
I’m not sure we need to debate the length question anymore. We can now use “content science” to analyze the common characteristics of the most popular content online. We don’t have to conclude debates of “how long should a topic be” with answers like “it depends.” The results are in. Longer is usually better. Shoot for 1,600 words but don’t be afraid to jack it up 2-3 times that. (My value arguments post was nearly 9,000 words long, but broken up into a series, which makes more sense to me.)
Not yet convinced? You’re reading a post that is about 4,500 words long. Let’s expand the data:
- For the top 10 posts of 2015, the average word count was 1,450. (See Top 10 posts in 2016.)
- For the top 10 posts of 2014, the average word count was 1,289 words. (See Top 10 posts, podcasts, tweets of 2014.)
I think in earlier years, I was following the model that online content should be short, but gradually I started writing longer posts. Long-form content (1,200 + words up to 5,000 +) is clearly trending. In How to Use Long Form Content to Skyrocket Your Search Rankings, the author notes that a study by Backlinko “found that on average, the sites occupying the first page of Google contain about 1,890 words hence.” The author cites another study by serpIQ that looked at top results from Google and had similar findings — “on average, posts with over 2,000 words are ranking much higher than shorter form posts.” Here’s the author’s graph:
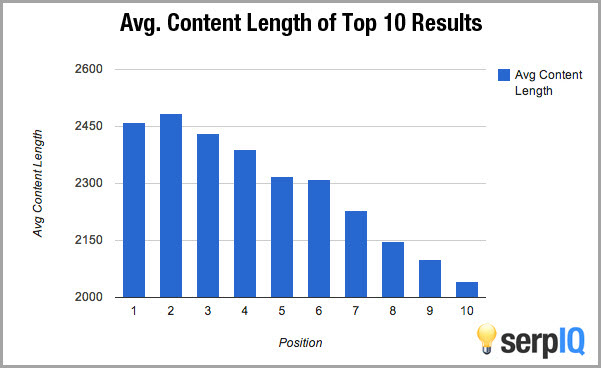
Long-form content trends higher in results because more people link to it (thus driving up the rank and authority of the page in Google). People link to long-form content because they perceive it to have more value. Because long-form content surfaces higher in Google’s results, more readers find it and thus promote it more – and so the cycle continues.
How do we square 1,600 words with the 1.58-minute average reading time (rather than 7-minute average reading time, which is what 1,600 words requires) that I observed in my metrics? Most likely the high bounce rate and less-than-ten-second reading times for many visitors throws askew what is probably the normal reading time for a post. That is, for posts that are actually relevant to readers (removing the less-than-10-second visitor), what is the average time they spend reading those posts? My guess is that it is probably at least 3-4 minutes. In that time span, readers can absorb more material. They can jump and scan around more.
Realization #4: Organic search trumps social media likes and retweets but lacks addictive checking behaviors
Despite the buzz that comes from sharing content on social media, traffic from social media accounts for a small percentage of my site visitors (about 3%). Most people arrive at my site through Google organic (unpaid) search (72%).
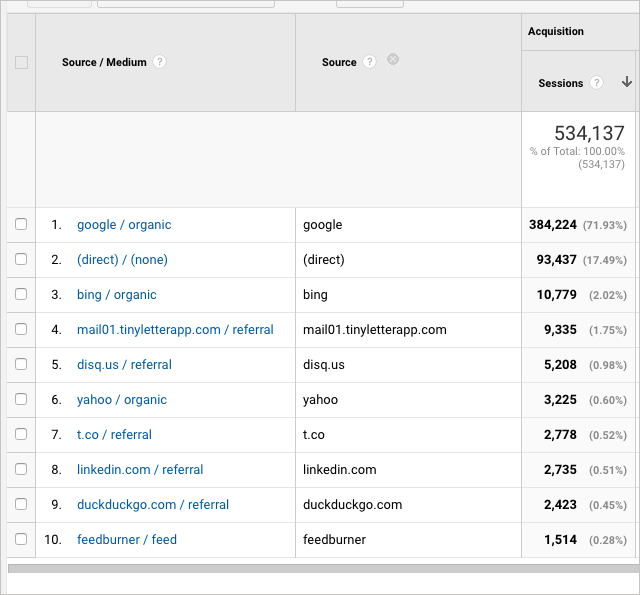
My newsletter is the tinyletterapp.com source – it drives 1.75%. “t.co” is Twitter – it brings in 0.52%. And linkedin.com traffic accounts for 0.51%. Heck, even referrals from duckduckgo.com are nearly the same percentage as those from linkedin.com! But organic search accounts for a whopping 72% of my site’s traffic. Even if you were to consider “(direct) / (none)” (which means Google doesn’t know the traffic source) as coming from social media, that’s still a small fraction of the traffic when compared to organic search.
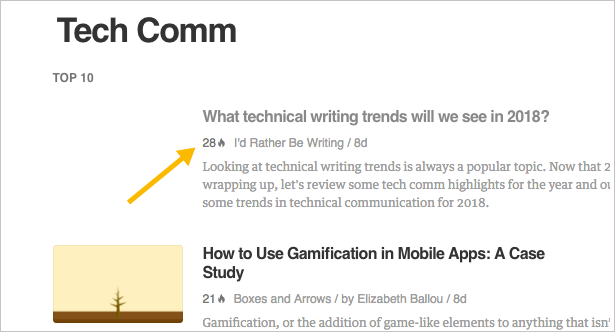
If social media traffic is a pittance compared to organic search, why do we seem to place so much emphasis on social media’s likes, shares, and retweets? There’s something biologically addictive (endorphin releases?) that happens when you see a retweet or a like on social media, or when you see a post shared so much that an actual fire icon appears in Feedly.
But is social media overrated as a traffic generator? Perhaps SEO for Google search should be the overriding concern in each article? Should I lace the content with SEO-rich keywords and phrases? Somehow, I tend to snooze on SEO and instead get more excited about shares on social media, even though I know social media accounts for very little overall traffic in comparison to Google’s organic search. Perhaps I need to find a way to integrate the same addictive checking behavior with Google analytics reports as I do with social media. Perhaps I could set Google’s Real Time traffic report in a more visible space:
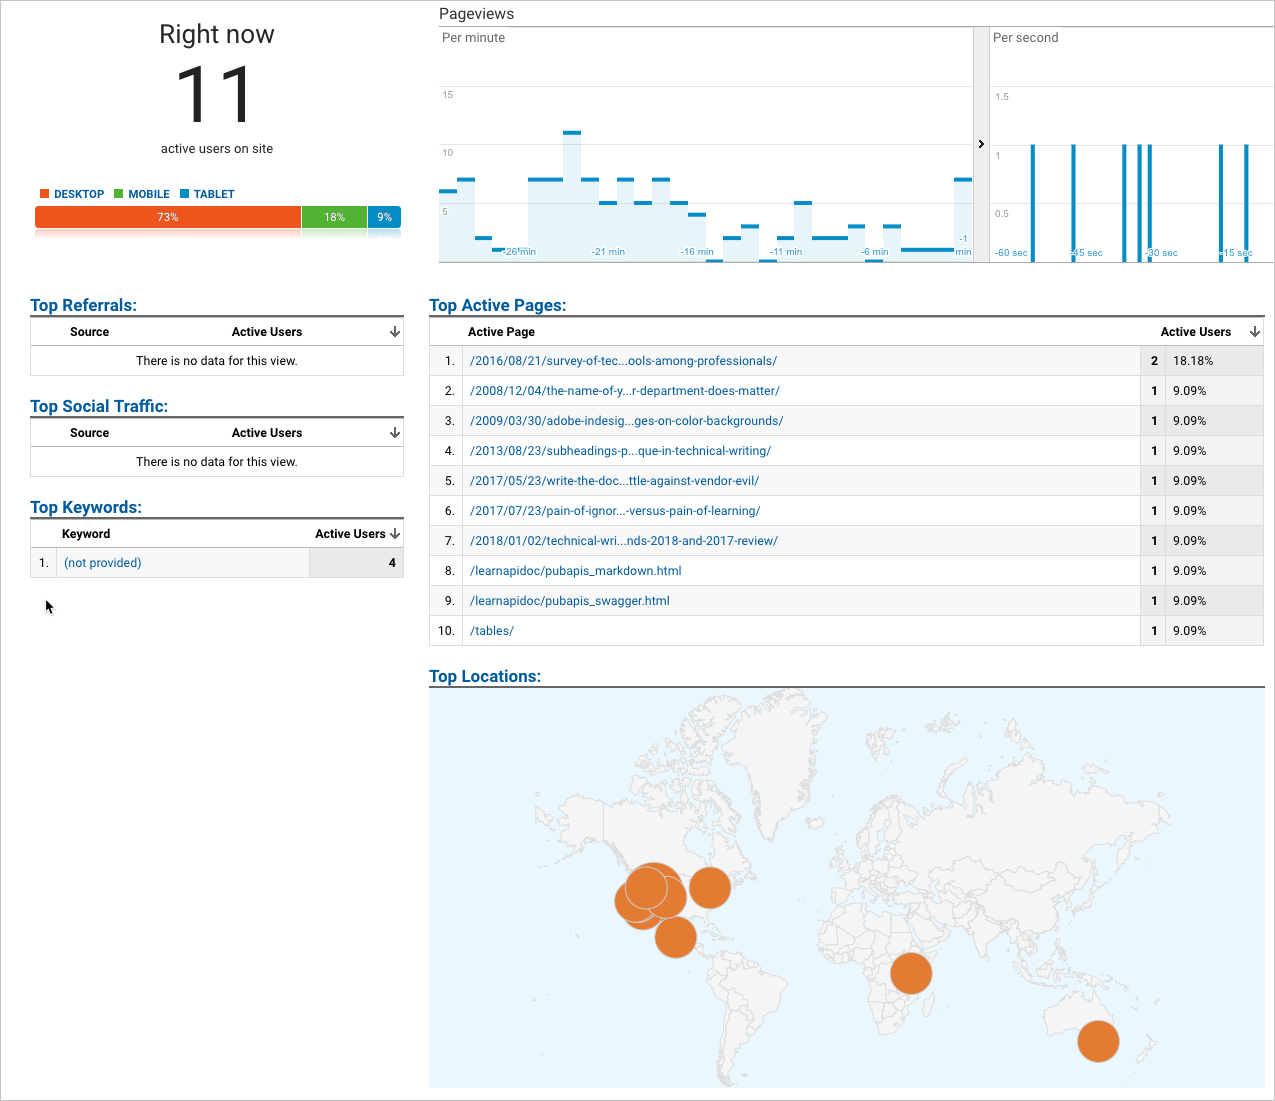
I doubt that will happen, though, because as I said earlier, I mostly write for myself.
What common form or technique emerged in popular posts?
What can we conclude about the writing techniques (the form) in these popular posts? Perhaps they form a pattern that can help me shape writing that is more powerful, that connects more firmly with people. What did I do right in some of those posts? Was it just the topic, or was it the way I approached it? Did the popular posts contain a story? A particular hook in the introduction, such as an anecdote that people connected with? Did I start with a reader question?
Although I glanced through each of the posts to try to detect a pattern, I could not see any. For example, the posts with a podcasts or graphics weren’t always the more popular. For the most part, with blog posts I try to start with a “relevance hook” — why is this topic suddenly relevant? Was there an experience I had, a newsworthy event, a question from a reader, or some other trigger? That’s just my form of writing. I think it’s a good practice, but I can’t say that it characterizes why posts become popular.
End summary
As an end description:
- Don’t neglect these topics: swagger, agile, trends, lain language, quick reference guides, TC careers, certificate programs, learning.
- Write posts that are 1,600 words or longer.
- Use contrarian trigger words in the titles.
- Write for SEO and regularly monitor Google Analytics.
What will you see in 2018 from my blog? I’ll finish up my API documentation content and publish it as an eBook. I’ll undertake a collaborative project (involving posts and podcasts) to change attitudes that practitioners and academics have toward each other. I’ll dive more into techniques for simplifying complexity, fashioning that content into a more full-length course or book. I’ll post more quick responses from reader questions that I usually answer via email. And I’ll follow up more on how to drive more value to tech comm by centering on pain points of support, field engineering, and marketing groups. So in the end, I’m not drawing my roadmap entirely based on these 2017 metrics. But I will probably keep posts long and make the titles more intriguing.
Similar posts
For similar posts analyzing metrics, see the following:
- Three Notable Characteristics of Top 10 Posts: Lists, Headings, Images
- Analyzing top posts on my blog during 2015 — Deciding between brand versus readership
- Top 10 posts, podcasts, tweets of 2014 – and what it all means
About Tom Johnson

I'm an API technical writer based in the Seattle area. On this blog, I write about topics related to technical writing and communication — such as software documentation, API documentation, AI, information architecture, content strategy, writing processes, plain language, tech comm careers, and more. Check out my API documentation course if you're looking for more info about documenting APIs. Or see my posts on AI and AI course section for more on the latest in AI and tech comm.
If you're a technical writer and want to keep on top of the latest trends in the tech comm, be sure to subscribe to email updates below. You can also learn more about me or contact me. Finally, note that the opinions I express on my blog are my own points of view, not that of my employer.